Delta Airlines 2013 Annual Report Download - page 90
Download and view the complete annual report
Please find page 90 of the 2013 Delta Airlines annual report below. You can navigate through the pages in the report by either clicking on the pages listed below, or by using the keyword search tool below to find specific information within the annual report.
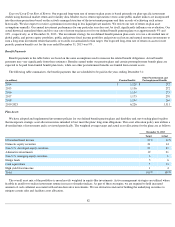
Expected Long-Term Rate of Return. Our expected long-term rate of return on plan assets is based primarily on plan-specific investment
studies using historical market return and volatility data. Modest excess return expectations versus some public market indices are incorporated
into the return projections based on the actively managed structure of the investment programs and their records of achieving such returns
historically. We also expect to receive a premium for investing in less liquid private markets. We review our rate of return on plan asset
assumptions annually. Our annual investment performance for one particular year does not, by itself, significantly influence our evaluation. Our
actual historical annualized three and five year rate of return on plan assets for our defined benefit pension plans was approximately 9% and
12% , respectively, as of December 31, 2013 . The investment strategy for our defined benefit pension plan assets is to use a diversified mix of
global public and private equity portfolios, public and private fixed income portfolios and private real estate and natural resource investments to
earn a long-term investment return that meets or exceeds our annualized return target. Our expected long-term rate of return on assets for net
periodic pension benefit cost for the year ended December 31, 2013 was 9% .
Benefit Payments
Benefit payments in the table below are based on the same assumptions used to measure the related benefit obligations. Actual benefit
payments may vary significantly from these estimates. Benefits earned under our pension plans and certain postemployment benefit plans are
expected to be paid from funded benefit plan trusts, while our other postretirement benefits are funded from current assets.
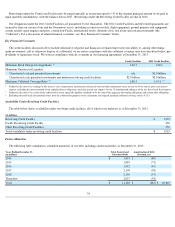
The following table summarizes, the benefit payments that are scheduled to be paid in the years ending December 31:
Plan Assets
We have adopted and implemented investment policies for our defined benefit pension plans and disability and survivorship plan for pilots
that incorporate strategic asset allocation mixes intended to best meet the plans' long-term obligations. This asset allocation policy mix utilizes a
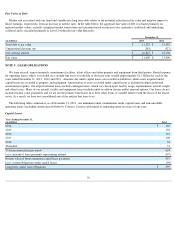
diversified mix of investments and is reviewed periodically. The weighted average target and actual asset allocations for the plans are as follows:
The overall asset mix of the portfolios is more heavily weighted in equity-like investments. Active management strategies are utilized where
feasible in an effort to realize investment returns in excess of market indices. As part of these strategies, we are required to hold increased
amounts of cash collateral associated with certain derivative investments. We use derivatives instead of holding the underlying securities to
mitigate certain risks and facilitate asset allocation.
82
(in millions) Pension Benefits Other Postretirement and
Postemployment Benefits
2014
$
1,128
$
272
2015
1,136
272
2016
1,154
273
2017
1,175
270
2018
1,194
264
2019-2023
6,226
1,311
December 31, 2013
Target Actual
Diversified fixed income
23
%
12
%
Domestic equity securities
21
14
Non-U.S. developed equity securities
20
23
Alternative investments
19
21
Non-U.S. emerging equity securities
6
6
Hedge funds
5
6
Cash equivalents
5
14
High yield fixed income
1
4
Total
100
%
100
%


