Delta Airlines 2013 Annual Report Download - page 92
Download and view the complete annual report
Please find page 92 of the 2013 Delta Airlines annual report below. You can navigate through the pages in the report by either clicking on the pages listed below, or by using the keyword search tool below to find specific information within the annual report.-
 1
1 -
2
-
3
-
4
-
5
-
6
-
7
-
8
-
9
-
10
-
11
-
12
-
13
-
14
-
15
-
16
-
17
-
18
-
19
-
20
-
21
-
22
-
23
-
24
-
25
-
26
-
27
-
28
-
29
-
30
-
31
-
32
-
33
-
34
-
35
-
36
-
37
-
38
-
39
-
40
-
41
-
42
-
43
-
44
-
45
-
46
-
47
-
48
-
49
-
50
-
51
-
52
-
53
-
54
-
55
-
56
-
57
-
58
-
59
-
60
-
61
-
62
-
63
-
64
-
65
-
66
-
67
-
68
-
69
-
70
-
71
-
72
-
73
-
74
-
75
-
76
-
77
-
78
-
79
-
80
-
81
-
 82
82 -
 83
83 -
 84
84 -
 85
85 -
 86
86 -
 87
87 -
 88
88 -
 89
89 -
 90
90 -
 91
91 -
 92
92 -
 93
93 -
 94
94 -
 95
95 -
 96
96 -
 97
97 -
 98
98 -
 99
99 -
 100
100 -
 101
101 -
 102
102 -
103
-
104
-
105
-
106
-
107
-
108
-
109
-
110
-
111
-
112
-
113
-
114
-
115
-
116
-
117
-
118
-
119
-
120
-
121
-
122
-
123
-
124
-
125
-
126
-
127
-
128
-
129
-
130
-
131
-
132
-
133
-
134
-
135
-
136
-
137
-
138
-
139
-
140
-
141
-
142
-
143
-
144
-
145
-
146
-
147
-
148
-
149
-
150
-
151
 |
 |

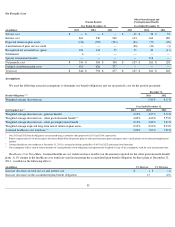
Common Stock. Common stock is valued at the closing price reported on the active market on which the individual securities are traded.
Mutual and Commingled Funds. These funds are valued using the net asset value divided by the number of shares outstanding, which is
based on quoted market prices of the underlying assets owned by the fund.
Alternative Investments. The valuation of alternative investments requires significant judgment due to the absence of quoted market prices as
well as the inherent lack of liquidity and the long-term nature of these assets. Accordingly, these assets are generally classified in Level 3.
Alternative investments include private equity, real estate, energy and timberland. Investments are valued based on valuation models where one
or more of the significant inputs into the model cannot be observed and which require the development of assumptions. We also assess the
potential for adjustment to the fair value of these investments due to the lag in the availability of data. In these cases, we solicit preliminary
valuation updates at year-end from the investment managers and use that information and corroborating data from public markets to determine
any needed adjustments to estimate fair value.
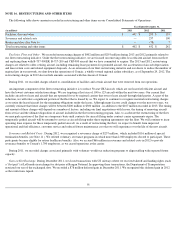
Fixed Income.
Investments include corporate bonds, government bonds, collateralized mortgage obligations and other asset backed securities.
These investments are generally valued at the bid price or the average of the bid and ask price. Prices are based on pricing models, quoted prices
of securities with similar characteristics, or broker quotes.
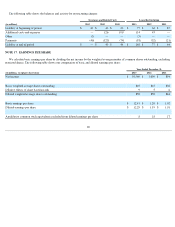
Hedge Funds. Our hedge fund investments are primarily made through shares of limited partnerships or similar structures for which a liquid
secondary market does not exist. Hedge funds are considered Level 3 assets. Hedge funds are valued monthly by a third-party administrator that
has been appointed by the fund's general partner.
Foreign Currency Derivatives. Our foreign currency derivatives consist of various forward contracts and are valued based on data readily
observable in public markets.
Cash Equivalents and Other. These investments primarily consist of short term investment funds which are valued using the net asset value.
Cash is not included in the table above.
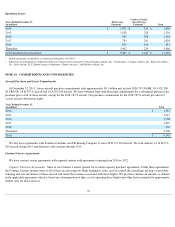
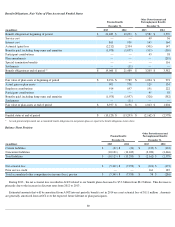
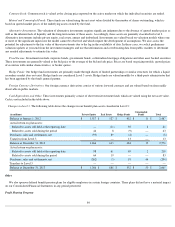
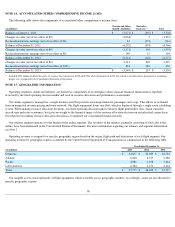
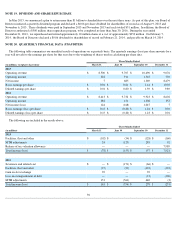
Changes in Level 3. The following table shows the changes in our benefit plan assets classified in Level 3:
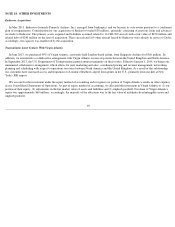
Other
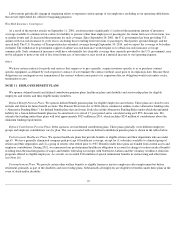
We also sponsor defined benefit pension plans for eligible employees in certain foreign countries. These plans did not have a material impact
on our Consolidated Financial Statements in any period presented.
Profit Sharing Program
84
(in millions) Private Equity Real Estate Hedge Funds Commingled
Funds Total
Balance at January 1, 2012
$
1,517
$
527
$
432
$
11
$
2,487
Actual return on plan assets:
Related to assets still held at the reporting date
—
(
11
)
50
2
41
Related to assets sold during the period
44
8
(9
)
—
43
Purchases, sales and settlements, net
(95
)
89
(2
)
—
(
8
)
Transfers from Level 3
—
—
13
—
13
Balance at December 31, 2012
1,466
613
484
13
2,576
Actual return on plan assets:
Related to assets still held at the reporting date
98
61
49
2
210
Related to assets sold during the period
64
19
—
—
83
Purchases, sales and settlements, net
(262
)
(5
)
19
44
(204
)
Transfers to Level 3
—
—
—
—
—
Balance at December 31, 2013
$
1,366
$
688
$
552
$
59
$
2,665