Delta Airlines 2013 Annual Report Download - page 61
Download and view the complete annual report
Please find page 61 of the 2013 Delta Airlines annual report below. You can navigate through the pages in the report by either clicking on the pages listed below, or by using the keyword search tool below to find specific information within the annual report.-
 1
1 -
2
-
3
-
4
-
5
-
6
-
7
-
8
-
9
-
10
-
11
-
12
-
13
-
14
-
15
-
16
-
17
-
18
-
19
-
20
-
21
-
22
-
23
-
24
-
25
-
26
-
27
-
28
-
29
-
30
-
31
-
32
-
33
-
34
-
35
-
36
-
37
-
38
-
39
-
40
-
41
-
42
-
43
-
44
-
45
-
46
-
47
-
48
-
49
-
50
-
 51
51 -
 52
52 -
 53
53 -
 54
54 -
 55
55 -
 56
56 -
 57
57 -
 58
58 -
 59
59 -
 60
60 -
 61
61 -
 62
62 -
 63
63 -
 64
64 -
 65
65 -
 66
66 -
 67
67 -
 68
68 -
 69
69 -
 70
70 -
 71
71 -
72
-
73
-
74
-
75
-
76
-
77
-
78
-
79
-
80
-
81
-
82
-
83
-
84
-
85
-
86
-
87
-
88
-
89
-
90
-
91
-
92
-
93
-
94
-
95
-
96
-
97
-
98
-
99
-
100
-
101
-
102
-
103
-
104
-
105
-
106
-
107
-
108
-
109
-
110
-
111
-
112
-
113
-
114
-
115
-
116
-
117
-
118
-
119
-
120
-
121
-
122
-
123
-
124
-
125
-
126
-
127
-
128
-
129
-
130
-
131
-
132
-
133
-
134
-
135
-
136
-
137
-
138
-
139
-
140
-
141
-
142
-
143
-
144
-
145
-
146
-
147
-
148
-
149
-
150
-
151
 |
 |
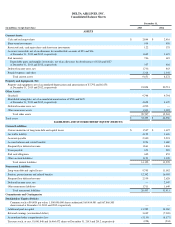
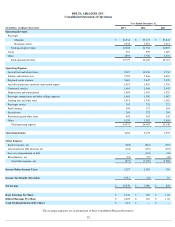
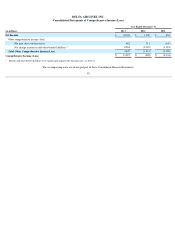
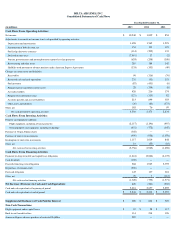
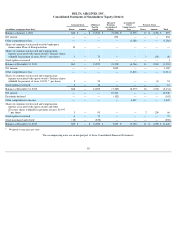
DELTA AIR LINES, INC.
Consolidated Statements of Cash Flows
Year Ended December 31,
(in millions) 2013
2012
2011
Cash Flows From Operating Activities:
Net income
$
10,540
$
1,009
$
854
Adjustments to reconcile net income to net cash provided by operating activities:
Depreciation and amortization
1,658
1,565
1,523
Amortization of debt discount, net
154
193
193
Fuel hedge derivative contracts
(114
)
(209
)
135
Deferred income taxes
(7,991
)
17
(2
)
Pension, postretirement and postemployment expense less than payments
(624
)
(208
)
(308
)
Restructuring and other items
285
184
142
SkyMiles used pursuant to advance purchase under American Express Agreements
(333
)
(333
)
(49
)
Changes in certain assets and liabilities:
Receivables
90
(116
)
(76
)
Restricted cash and cash equivalents
231
(51
)
153
Fuel inventory
(87
)
(451
)
(8
)
Prepaid expenses and other current assets
28
(134
)
(8
)
Air traffic liability
426
216
174
Frequent flyer deferred revenue
(121
)
(115
)
82
Accounts payable and accrued liabilities
213
899
303
Other assets and liabilities
(36
)
(66
)
(373
)
Other, net
185
76
99
Net cash provided by operating activities
4,504
2,476
2,834
Cash Flows From Investing Activities:
Property and equipment additions:
Flight equipment, including advance payments
(2,117
)
(1,196
)
(907
)
Ground property and equipment, including technology
(451
)
(772
)
(347
)
Purchase of Virgin Atlantic shares
(360
)
—
—
Purchase of short-term investments
(959
)
(958
)
(1,078
)
Redemption of short-term investments
1,117
1,019
844
Other, net
14
(55
)
(10
)
Net cash used in investing activities
(2,756
)
(1,962
)
(1,498
)
Cash Flows From Financing Activities:
Payments on long-term debt and capital lease obligations
(1,461
)
(2,864
)
(4,172
)
Cash dividends
(102
)
—
—
Proceeds from long-term obligations
268
1,965
2,395
Repurchase of common stock
(250
)
—
—
Fuel card obligation
147
137
318
Other, net
78
7
(112
)
Net cash used in financing activities
(1,320
)
(755
)
(1,571
)
Net Increase (Decrease) in Cash and Cash Equivalents
428
(241
)
(235
)
Cash and cash equivalents at beginning of period
2,416
2,657
2,892
Cash and cash equivalents at end of period
$
2,844
$
2,416
$
2,657
Supplemental Disclosure of Cash Paid for Interest
$
698
$
834
$
925
Non-Cash Transactions:
Flight equipment under capital leases
$
67
$
28
$
117
Built-to-suit leased facilities
114
214
126
American Express advance purchase of restricted SkyMiles
285
—
—