Delta Airlines 2013 Annual Report Download - page 40
Download and view the complete annual report
Please find page 40 of the 2013 Delta Airlines annual report below. You can navigate through the pages in the report by either clicking on the pages listed below, or by using the keyword search tool below to find specific information within the annual report.-
 1
1 -
2
-
3
-
4
-
5
-
6
-
7
-
8
-
9
-
10
-
11
-
12
-
13
-
14
-
15
-
16
-
17
-
18
-
19
-
20
-
21
-
22
-
23
-
24
-
25
-
26
-
27
-
28
-
29
-
 30
30 -
 31
31 -
 32
32 -
 33
33 -
 34
34 -
 35
35 -
 36
36 -
 37
37 -
 38
38 -
 39
39 -
 40
40 -
 41
41 -
 42
42 -
 43
43 -
 44
44 -
 45
45 -
 46
46 -
 47
47 -
 48
48 -
 49
49 -
 50
50 -
51
-
52
-
53
-
54
-
55
-
56
-
57
-
58
-
59
-
60
-
61
-
62
-
63
-
64
-
65
-
66
-
67
-
68
-
69
-
70
-
71
-
72
-
73
-
74
-
75
-
76
-
77
-
78
-
79
-
80
-
81
-
82
-
83
-
84
-
85
-
86
-
87
-
88
-
89
-
90
-
91
-
92
-
93
-
94
-
95
-
96
-
97
-
98
-
99
-
100
-
101
-
102
-
103
-
104
-
105
-
106
-
107
-
108
-
109
-
110
-
111
-
112
-
113
-
114
-
115
-
116
-
117
-
118
-
119
-
120
-
121
-
122
-
123
-
124
-
125
-
126
-
127
-
128
-
129
-
130
-
131
-
132
-
133
-
134
-
135
-
136
-
137
-
138
-
139
-
140
-
141
-
142
-
143
-
144
-
145
-
146
-
147
-
148
-
149
-
150
-
151
 |
 |

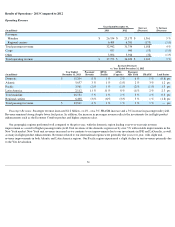
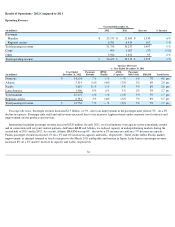
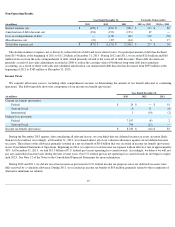
Results of Operations - 2012 Compared to 2011
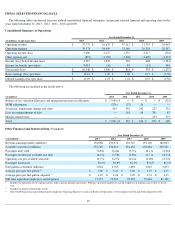
Operating Revenue
Passenger Revenue. Passenger revenue increased $1.5 billion , or 5% , due to an improvement in the passenger mile yield of 5% , on a 2%
decline in capacity. Passenger mile yield and unit revenue increased due to fare increases, higher revenue under corporate travel contracts and
improvements in our products and services.
International mainline passenger revenue increased $520 million. In early 2011, we faced industry overcapacity in the transatlantic market
and in connection with our joint venture partners, AirFrance-KLM and Alitalia, we reduced capacity in underperforming markets during the
second half of 2011 and in 2012. As a result, Atlantic PRASM was up 6% , driven by a 3% increase in yield on a 7% decrease in capacity.
Pacific passenger revenue increased 11% on a 3% and 6% increase in capacity and traffic, respectively. These results reflect Pacific market
improvement, as demand returned to levels seen prior to the March 2011 earthquake and tsunami in Japan. Latin America passenger revenue
increased 8% on a 3% and 6% increase in capacity and traffic, respectively.
34
Year Ended December 31,
Increase % Increase (in millions) 2012 2011
Passenger:
Mainline
$
25,173
$
23,843
$
1,330
6
%
Regional carriers
6,581
6,414
167
3
%
Total passenger revenue
31,754
30,257
1,497
5
%
Cargo
990
1,027
(37
)
(4
)%
Other
3,926
3,831
95
2
%
Total operating revenue
$
36,670
$
35,115
$
1,555
4
%
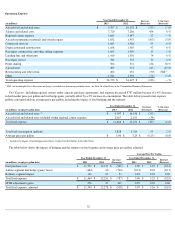
Increase (Decrease)
vs. Year Ended December 31, 2011
(in millions) Year Ended
December 31, 2012 Passenger
Revenue RPMs
(Traffic) ASMs
(Capacity) Passenger
Mile Yield PRASM Load Factor
Domestic
$
14,134
7
%
1
%
—
%
6
%
7
%
0.8
pts
Atlantic
5,514
(1
)%
(4
)%
(7
)%
3
%
6
%
2.8
pts
Pacific
3,619
11
%
6
%
3
%
5
%
8
%
2.6
pts
Latin America
1,906
8
%
6
%
3
%
2
%
5
%
2.7
pts
Total mainline
25,173
6
%
1
%
(1
)%
5
%
7
%
1.7
pts
Regional carriers
6,581
3
%
(4
)%
(5
)%
7
%
8
%
0.7
pts
Total passenger revenue
$
31,754
5
%
—
%
(
2
)%
5
%
7
%
1.7
pts