Delta Airlines 2013 Annual Report Download - page 146
Download and view the complete annual report
Please find page 146 of the 2013 Delta Airlines annual report below. You can navigate through the pages in the report by either clicking on the pages listed below, or by using the keyword search tool below to find specific information within the annual report.-
 1
1 -
2
-
3
-
4
-
5
-
6
-
7
-
8
-
9
-
10
-
11
-
12
-
13
-
14
-
15
-
16
-
17
-
18
-
19
-
20
-
21
-
22
-
23
-
24
-
25
-
26
-
27
-
28
-
29
-
30
-
31
-
32
-
33
-
34
-
35
-
36
-
37
-
38
-
39
-
40
-
41
-
42
-
43
-
44
-
45
-
46
-
47
-
48
-
49
-
50
-
51
-
52
-
53
-
54
-
55
-
56
-
57
-
58
-
59
-
60
-
61
-
62
-
63
-
64
-
65
-
66
-
67
-
68
-
69
-
70
-
71
-
72
-
73
-
74
-
75
-
76
-
77
-
78
-
79
-
80
-
81
-
82
-
83
-
84
-
85
-
86
-
87
-
88
-
89
-
90
-
91
-
92
-
93
-
94
-
95
-
96
-
97
-
98
-
99
-
100
-
101
-
102
-
103
-
104
-
105
-
106
-
107
-
108
-
109
-
110
-
111
-
112
-
113
-
114
-
115
-
116
-
117
-
118
-
119
-
120
-
121
-
122
-
123
-
124
-
125
-
126
-
127
-
128
-
129
-
130
-
131
-
132
-
133
-
134
-
135
-
 136
136 -
 137
137 -
 138
138 -
 139
139 -
 140
140 -
 141
141 -
 142
142 -
 143
143 -
 144
144 -
 145
145 -
 146
146 -
 147
147 -
 148
148 -
 149
149 -
 150
150 -
 151
151
 |
 |
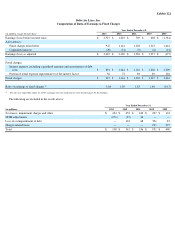
Exhibit 12.1
Delta Air Lines, Inc.
Computation of Ratio of Earnings to Fixed Charges
The following are included in the results above:
Year Ended December 31,
(in millions, except for ratio data) 2013 2012 2011 2010 2009
Earnings (loss) before income taxes
$
2,527
$
1,025
$
769
$
608
$
(1,581
)
Add (deduct):
Fixed charges from below
947
1,116
1,202
1,315
1,416
Capitalized interest
(29
)
(21
)
(9
)
(6
)
(12
)
Earnings (loss) as adjusted
$
3,445
$
2,120
$
1,962
$
1,917
$
(177
)
Fixed charges:
Interest expense, including capitalized amounts and amortization of debt
costs
$
891
$
1,044
$
1,122
$
1,226
$
1,290
Portion of rental expense representative of the interest factor
56
72
80
89
126
Fixed charges
$
947
$
1,116
$
1,202
$
1,315
$
1,416
Ratio of earnings to fixed charges
(1)
3.64
1.90
1.63
1.46
(0.13
)
(1)
For the year ended December 31, 2009, earnings were not sufficient to cover fixed charges by $1.6 billion.
Year Ended December 31,
(in millions) 2013 2012 2011 2010 2009
Severance, impairment charges and other
$
424
$
452
$
242
$
227
$
132
MTM adjustments
(276
)
(27
)
26
—
—
Loss on extinguishment of debt —
118
68
391
83
Merger-related items —
—
—
233
275
Total
$
148
$
543
$
336
$
851
$
490