Delta Airlines 2013 Annual Report Download - page 10
Download and view the complete annual report
Please find page 10 of the 2013 Delta Airlines annual report below. You can navigate through the pages in the report by either clicking on the pages listed below, or by using the keyword search tool below to find specific information within the annual report.-
 1
1 -
 2
2 -
 3
3 -
 4
4 -
 5
5 -
 6
6 -
 7
7 -
 8
8 -
 9
9 -
 10
10 -
 11
11 -
 12
12 -
 13
13 -
 14
14 -
 15
15 -
 16
16 -
 17
17 -
 18
18 -
 19
19 -
 20
20 -
 21
21 -
22
-
23
-
24
-
25
-
26
-
27
-
28
-
29
-
30
-
31
-
32
-
33
-
34
-
35
-
36
-
37
-
38
-
39
-
40
-
41
-
42
-
43
-
44
-
45
-
46
-
47
-
48
-
49
-
50
-
51
-
52
-
53
-
54
-
55
-
56
-
57
-
58
-
59
-
60
-
61
-
62
-
63
-
64
-
65
-
66
-
67
-
68
-
69
-
70
-
71
-
72
-
73
-
74
-
75
-
76
-
77
-
78
-
79
-
80
-
81
-
82
-
83
-
84
-
85
-
86
-
87
-
88
-
89
-
90
-
91
-
92
-
93
-
94
-
95
-
96
-
97
-
98
-
99
-
100
-
101
-
102
-
103
-
104
-
105
-
106
-
107
-
108
-
109
-
110
-
111
-
112
-
113
-
114
-
115
-
116
-
117
-
118
-
119
-
120
-
121
-
122
-
123
-
124
-
125
-
126
-
127
-
128
-
129
-
130
-
131
-
132
-
133
-
134
-
135
-
136
-
137
-
138
-
139
-
140
-
141
-
142
-
143
-
144
-
145
-
146
-
147
-
148
-
149
-
150
-
151
 |
 |

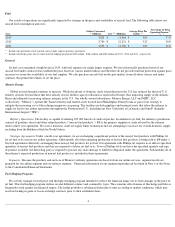
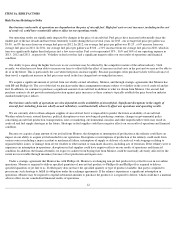
Fuel
Our results of operations are significantly impacted by changes in the price and availability of aircraft fuel. The following table shows our
aircraft fuel consumption and costs.
General
Jet fuel costs remained at high levels in 2013, with fuel expense our single largest expense. We have historically purchased most of our
aircraft fuel under contracts that establish the price based on various market indices and therefore do not provide material protection against price
increases or assure the availability of our fuel supplies. We also purchase aircraft fuel on the spot market, from off-shore sources and under
contracts that permit the refiners to set the price.
Monroe Energy
Global jet fuel demand continues to increase. While the advent of domestic shale oil production in the U.S. has reduced the threat of U.S.
refinery closures beyond those that have already closed, further capacity reduction is expected in Europe, thus impacting supply in the Atlantic
Basin and ultimately increasing refinery margins in the U.S. Our wholly-owned subsidiaries, Monroe Energy, LLC and MIPC, LLC
(collectively, “Monroe”), operate the Trainer refinery and related assets located near Philadelphia, Pennsylvania as part of our strategy to
mitigate the increasing cost of the refining margin we are paying. The facilities include pipelines and terminal assets that allow the refinery to
supply jet fuel to our airline operations throughout the Northeastern U.S., including our New York hubs at LaGuardia and John F. Kennedy
International Airport ("JFK").
Refinery Operations. The facility is capable of refining 185,000 barrels of crude oil per day. In addition to jet fuel, the refinery's production
consists of gasoline, diesel and other refined products (“non-jet fuel products”). BP is the primary supplier of crude oil used by the refinery
under a three year agreement. We source domestic crude oil supply when economical and are attempting to increase our overall domestic supply,
including from the Bakken oil field in North Dakota.
Strategic Agreements. Under a multi-year agreement, we are exchanging a significant portion of the non-jet fuel products with Phillips 66
for jet fuel to be used in our airline operations. Substantially all of the remaining production of non-jet fuel products is being sold to BP under a
buy/sell agreement effectively exchanging those non-
jet fuel products for jet fuel. Our agreement with Phillips 66 requires us to deliver specified
quantities of non-jet fuel products and they are required to deliver jet fuel to us. If we or Phillips 66 do not have the specified quantity and type
of product available, the delivering party is required to procure any such shortage to fulfill its obligation under the agreement. Substantially all of
the refinery's expected production of non-jet fuel products is included in these agreements.
Segments . Because the products and services of Monroe's refinery operations are discrete from our airline services, segment results are
prepared for our airline segment and our refinery segment. Financial information on our segment reporting can be found in Note 2 of the Notes
to the Consolidated Financial Statements.
Fuel Hedging Program
We actively manage our fuel price risk through a hedging program intended to reduce the financial impact on us from changes in the price of
jet fuel.
This fuel hedging program utilizes several different contract and commodity types.
The economic effectiveness of this hedge portfolio is
frequently tested against our financial targets. The hedge portfolio is rebalanced from time to time according to market conditions, which may
result in locking in gains or losses on hedge contracts prior to their settlement dates.
4
Year Gallons Consumed
(1)
(Millions) Cost
(1)(2)
(Millions)
Average Price Per
Gallon
(1)(2)
Percentage of Total
Operating Expense
(1)
(2)
2013
3,828
$
11,464
$
3.00
33
%
2012
3,769
$
12,251
$
3.25
36
%
2011
3,856
$
11,783
$
3.06
36
%
(1)
Includes the operations of our regional carriers under capacity purchase agreements.
(2)
Includes fuel hedge gains (losses) under our fuel hedging program of $493 million , $(66) million and $420 million for 2013 , 2012 and 2011
, respectively.