Delta Airlines 2013 Annual Report Download - page 95
Download and view the complete annual report
Please find page 95 of the 2013 Delta Airlines annual report below. You can navigate through the pages in the report by either clicking on the pages listed below, or by using the keyword search tool below to find specific information within the annual report.-
 1
1 -
2
-
3
-
4
-
5
-
6
-
7
-
8
-
9
-
10
-
11
-
12
-
13
-
14
-
15
-
16
-
17
-
18
-
19
-
20
-
21
-
22
-
23
-
24
-
25
-
26
-
27
-
28
-
29
-
30
-
31
-
32
-
33
-
34
-
35
-
36
-
37
-
38
-
39
-
40
-
41
-
42
-
43
-
44
-
45
-
46
-
47
-
48
-
49
-
50
-
51
-
52
-
53
-
54
-
55
-
56
-
57
-
58
-
59
-
60
-
61
-
62
-
63
-
64
-
65
-
66
-
67
-
68
-
69
-
70
-
71
-
72
-
73
-
74
-
75
-
76
-
77
-
78
-
79
-
80
-
81
-
82
-
83
-
84
-
 85
85 -
 86
86 -
 87
87 -
 88
88 -
 89
89 -
 90
90 -
 91
91 -
 92
92 -
 93
93 -
 94
94 -
 95
95 -
 96
96 -
 97
97 -
 98
98 -
 99
99 -
 100
100 -
 101
101 -
 102
102 -
 103
103 -
 104
104 -
 105
105 -
106
-
107
-
108
-
109
-
110
-
111
-
112
-
113
-
114
-
115
-
116
-
117
-
118
-
119
-
120
-
121
-
122
-
123
-
124
-
125
-
126
-
127
-
128
-
129
-
130
-
131
-
132
-
133
-
134
-
135
-
136
-
137
-
138
-
139
-
140
-
141
-
142
-
143
-
144
-
145
-
146
-
147
-
148
-
149
-
150
-
151
 |
 |

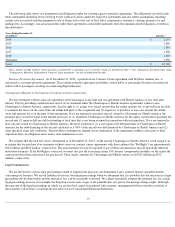
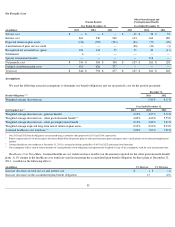
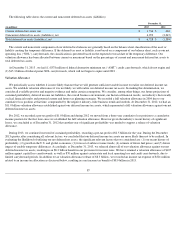
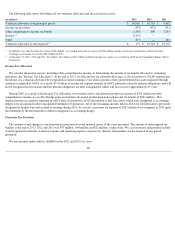
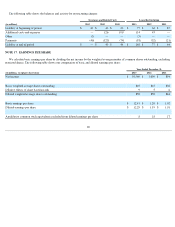
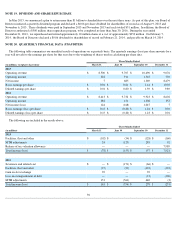
The following table shows the current and noncurrent deferred tax assets (liabilities):
The current and noncurrent components of our deferred tax balances are generally based on the balance sheet classification of the asset or
liability creating the temporary difference. If the deferred tax asset or liability is not based on a component of our balance sheet, such as our net
operating loss (“NOL”) carryforwards, the classification is presented based on the expected reversal date of the temporary difference. Our
valuation allowance has been allocated between current or noncurrent based on the percentages of current and noncurrent deferred tax assets to
total deferred tax assets.
At December 31, 2013 , we had (1) $378 million of federal alternative minimum tax (“AMT”) credit carryforwards, which do not expire and
(2) $15.3 billion of federal pretax NOL carryforwards, which will not begin to expire until 2023 .
Valuation Allowance
We periodically assess whether it is more likely than not that we will generate sufficient taxable income to realize our deferred income tax
assets. We establish valuation allowances if it is not likely we will realize our deferred income tax assets. In making this determination, we
consider all available positive and negative evidence and make certain assumptions. We consider, among other things, our future projections of
sustained profitability, deferred income tax liabilities, the overall business environment, our historical financial results, our industry's historically
cyclical financial results and potential current and future tax planning strategies. We recorded a full valuation allowance in 2004 due to our
cumulative loss position at that time, compounded by the negative industry-wide business trends and outlook. At December 31, 2012, we had an
$11.0 billion
valuation allowance established against our deferred income tax assets, which represented a full valuation allowance against our net
deferred income tax assets.
For 2012, we recorded a pre-tax profit of $1.0 billion and during 2012 we moved from a three-year cumulative loss position to a cumulative
income position for the first time since we established the full valuation allowance. However given the industry's recent history of significant
losses, we concluded as of December 31, 2012 that another year of significant profitability was needed to support a release of valuation
allowance.
During 2013, we continued our trend of sustained profitability, recording a pre-tax profit of $2.5 billion for the year. During the December
2013 quarter, after considering all relevant factors, we concluded that our deferred income tax assets are more likely than not to be realized. In
evaluating the likelihood of utilizing our net deferred net assets, the significant relevant factors that we considered are: (1) our recent history of
profitability; (2) growth in the U.S. and global economies; (3) forecast of airline revenue trends; (4) estimate of future fuel prices; and (5) future
impact of taxable temporary differences. Accordingly, at December 31, 2013, we released almost all of our valuation allowance against our net
deferred income tax assets, resulting in an $8.3 billion benefit in our provision for income taxes. We have retained a valuation allowance of
$107
million against capital loss carryforwards, as well as $70 million against certain state and local operating loss and credit carryforwards, due to
limited carryforward periods. In addition to tax valuation allowance release of $8.3 billion , we recorded an income tax expense of $321 million
related to an income tax allocation as discussed below, resulting in a net income tax benefit of $8.0 billion in 2013.
87
December 31,
(in millions) 2013 2012
Current deferred tax assets, net
$
1,736
$
463
Noncurrent deferred tax assets (liabilities), net
4,992
(2,047
)
Total deferred tax assets (liabilities), net
$
6,728
$
(1,584
)