Delta Airlines 2013 Annual Report Download - page 72
Download and view the complete annual report
Please find page 72 of the 2013 Delta Airlines annual report below. You can navigate through the pages in the report by either clicking on the pages listed below, or by using the keyword search tool below to find specific information within the annual report.-
 1
1 -
2
-
3
-
4
-
5
-
6
-
7
-
8
-
9
-
10
-
11
-
12
-
13
-
14
-
15
-
16
-
17
-
18
-
19
-
20
-
21
-
22
-
23
-
24
-
25
-
26
-
27
-
28
-
29
-
30
-
31
-
32
-
33
-
34
-
35
-
36
-
37
-
38
-
39
-
40
-
41
-
42
-
43
-
44
-
45
-
46
-
47
-
48
-
49
-
50
-
51
-
52
-
53
-
54
-
55
-
56
-
57
-
58
-
59
-
60
-
61
-
 62
62 -
 63
63 -
 64
64 -
 65
65 -
 66
66 -
 67
67 -
 68
68 -
 69
69 -
 70
70 -
 71
71 -
 72
72 -
 73
73 -
 74
74 -
 75
75 -
 76
76 -
 77
77 -
 78
78 -
 79
79 -
 80
80 -
 81
81 -
 82
82 -
83
-
84
-
85
-
86
-
87
-
88
-
89
-
90
-
91
-
92
-
93
-
94
-
95
-
96
-
97
-
98
-
99
-
100
-
101
-
102
-
103
-
104
-
105
-
106
-
107
-
108
-
109
-
110
-
111
-
112
-
113
-
114
-
115
-
116
-
117
-
118
-
119
-
120
-
121
-
122
-
123
-
124
-
125
-
126
-
127
-
128
-
129
-
130
-
131
-
132
-
133
-
134
-
135
-
136
-
137
-
138
-
139
-
140
-
141
-
142
-
143
-
144
-
145
-
146
-
147
-
148
-
149
-
150
-
151
 |
 |

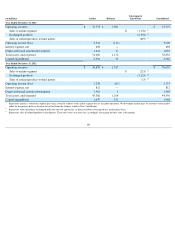
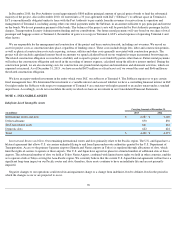
64
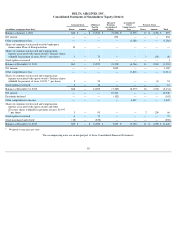
(in millions) Airline Refinery Intersegment
Sales/Other Consolidated
Year Ended December 31, 2013
Operating revenue:
$
37,773
$
7,003
$
37,773
Sales to airline segment
$
(1,156
)
(1)
Exchanged products
(5,352
)
(2)
Sales of refined products to third parties
(495
)
(3)
Operating income (loss)
3,516
(116
)
3,400
Interest expense, net
698
—
698
Depreciation and amortization expense
1,641
17
1,658
Total assets, end of period
51,080
1,172
52,252
Capital expenditures
2,516
52
2,568
Year Ended December 31, 2012
Operating revenue:
$
36,670
$
1,347
$
36,670
Sales to airline segment
$
(213
)
(1)
Exchanged products
(1,121
)
(2)
Sales of refined products to third parties
(13
)
(3)
Operating income (loss)
2,238
(63
)
2,175
Interest expense, net
812
—
812
Depreciation and amortization expense
1,561
4
1,565
Total assets, end of period
43,386
1,164
44,550
Capital expenditures
1,637
331
1,968
(1)
Represents transfers, valued on a market price basis, from the refinery to the airline segment for use in airline operations. We determine market price by reference to the market
index for the primary delivery location for jet fuel from the refinery, which is New York Harbor.
(2)
Represents value of products exchanged under our buy/sell agreements, as discussed above, determined on a market price basis.
(3)
Represents sales of refined products to third parties. These sales were at or near cost; accordingly, the margin on these sales is de minimis.