Delta Airlines 2013 Annual Report Download - page 68
Download and view the complete annual report
Please find page 68 of the 2013 Delta Airlines annual report below. You can navigate through the pages in the report by either clicking on the pages listed below, or by using the keyword search tool below to find specific information within the annual report.-
 1
1 -
2
-
3
-
4
-
5
-
6
-
7
-
8
-
9
-
10
-
11
-
12
-
13
-
14
-
15
-
16
-
17
-
18
-
19
-
20
-
21
-
22
-
23
-
24
-
25
-
26
-
27
-
28
-
29
-
30
-
31
-
32
-
33
-
34
-
35
-
36
-
37
-
38
-
39
-
40
-
41
-
42
-
43
-
44
-
45
-
46
-
47
-
48
-
49
-
50
-
51
-
52
-
53
-
54
-
55
-
56
-
57
-
 58
58 -
 59
59 -
 60
60 -
 61
61 -
 62
62 -
 63
63 -
 64
64 -
 65
65 -
 66
66 -
 67
67 -
 68
68 -
 69
69 -
 70
70 -
 71
71 -
 72
72 -
 73
73 -
 74
74 -
 75
75 -
 76
76 -
 77
77 -
 78
78 -
79
-
80
-
81
-
82
-
83
-
84
-
85
-
86
-
87
-
88
-
89
-
90
-
91
-
92
-
93
-
94
-
95
-
96
-
97
-
98
-
99
-
100
-
101
-
102
-
103
-
104
-
105
-
106
-
107
-
108
-
109
-
110
-
111
-
112
-
113
-
114
-
115
-
116
-
117
-
118
-
119
-
120
-
121
-
122
-
123
-
124
-
125
-
126
-
127
-
128
-
129
-
130
-
131
-
132
-
133
-
134
-
135
-
136
-
137
-
138
-
139
-
140
-
141
-
142
-
143
-
144
-
145
-
146
-
147
-
148
-
149
-
150
-
151
 |
 |

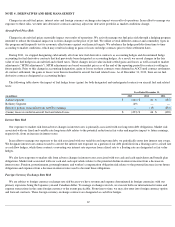
Breakage. For mileage credits that we estimate are not likely to be redeemed (“breakage”), we recognize the associated value proportionally
during the period in which the remaining mileage credits are expected to be redeemed. Management uses statistical models to estimate breakage
based on historical redemption patterns. A change in assumptions as to the period over which mileage credits are expected to be redeemed, the
actual redemption activity for mileage credits or the estimated fair value of mileage credits expected to be redeemed could have a material
impact on our revenue in the year in which the change occurs and in future years.
Regional Carriers Revenue
During the year ended December 31, 2013 , we had contract carrier agreements with third party regional carriers ("Contract Carriers"), in
addition to our wholly-
owned subsidiary, Endeavor. In May 2013, Endeavor (formerly Pinnacle Airlines, Inc.) emerged from bankruptcy and we
became its sole owner pursuant to a confirmed plan of reorganization. Our wholly-owned subsidiary, Comair, Inc. ("Comair") ceased operations
in September 2012 (see Note 16).
Our Contract Carrier agreements are structured as either (1) capacity purchase agreements where we purchase all or a portion of the Contract
Carrier's capacity and are responsible for selling the seat inventory we purchase or (2) revenue proration agreements, which are based on a fixed
dollar or percentage division of revenues for tickets sold to passengers traveling on connecting flight itineraries. We record revenue related to all
of our Contract Carrier agreements as regional carriers passenger revenue. We record expenses related to our Contract Carrier agreements, as
regional carrier expense.
Cargo Revenue
Cargo revenue is recognized when we provide the transportation.
Other Revenue
Other revenue is primarily comprised of (1) the marketing component of the sale of mileage credits discussed above, (2) baggage fee
revenue, (3) other miscellaneous service revenue, including ticket change fees and (4) revenue from ancillary businesses, such as the aircraft
maintenance and repair and staffing services we provide to third parties.
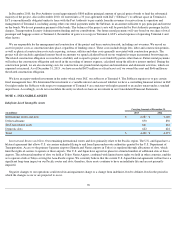
Long
-Lived Assets
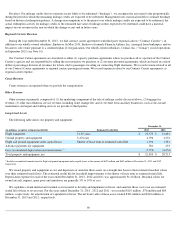
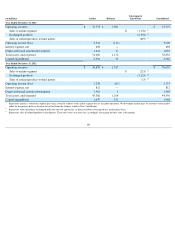
The following table shows our property and equipment:
(1)
Includes accumulated amortization for flight and ground equipment under capital leases in the amount of $657 million and $653 million at December 31, 2013 and 2012 ,
respectively.
We record property and equipment at cost and depreciate or amortize these assets on a straight-line basis to their estimated residual values
over their estimated useful lives. The estimated useful life for leasehold improvements is the shorter of lease term or estimated useful life.
Depreciation expense for each of the years ended December 31, 2013 , 2012 and 2011 was approximately $1.4 billion . Residual values for
owned aircraft, engines, spare parts and simulators are generally 5% to 10% of cost.
We capitalize certain internal and external costs incurred to develop and implement software, and amortize those costs over an estimated
useful life of three to seven years. For the years ended December 31, 2013 , 2012 and 2011 , we recorded $110 million , $76 million and $64
million , respectively, for amortization of capitalized software. The net book value of these assets totaled $383 million and $344 million at
December 31, 2013 and 2012 , respectively.
60
December 31,
(in millions, except for estimated useful life) Estimated Useful Life 2013 2012
Flight equipment 21-30 years
$
23,373
$
21,481
Ground property and equipment 3-40 years
4,596
4,254
Flight and ground equipment under capital leases Shorter of lease term or estimated useful life
1,296
1,381
Advance payments for equipment
381
253
Less: accumulated depreciation and amortization
(1)
(7,792
)
(6,656
)
Total property and equipment, net
$
21,854
$
20,713