Delta Airlines 2013 Annual Report Download - page 38
Download and view the complete annual report
Please find page 38 of the 2013 Delta Airlines annual report below. You can navigate through the pages in the report by either clicking on the pages listed below, or by using the keyword search tool below to find specific information within the annual report.-
 1
1 -
2
-
3
-
4
-
5
-
6
-
7
-
8
-
9
-
10
-
11
-
12
-
13
-
14
-
15
-
16
-
17
-
18
-
19
-
20
-
21
-
22
-
23
-
24
-
25
-
26
-
27
-
 28
28 -
 29
29 -
 30
30 -
 31
31 -
 32
32 -
 33
33 -
 34
34 -
 35
35 -
 36
36 -
 37
37 -
 38
38 -
 39
39 -
 40
40 -
 41
41 -
 42
42 -
 43
43 -
 44
44 -
 45
45 -
 46
46 -
 47
47 -
 48
48 -
49
-
50
-
51
-
52
-
53
-
54
-
55
-
56
-
57
-
58
-
59
-
60
-
61
-
62
-
63
-
64
-
65
-
66
-
67
-
68
-
69
-
70
-
71
-
72
-
73
-
74
-
75
-
76
-
77
-
78
-
79
-
80
-
81
-
82
-
83
-
84
-
85
-
86
-
87
-
88
-
89
-
90
-
91
-
92
-
93
-
94
-
95
-
96
-
97
-
98
-
99
-
100
-
101
-
102
-
103
-
104
-
105
-
106
-
107
-
108
-
109
-
110
-
111
-
112
-
113
-
114
-
115
-
116
-
117
-
118
-
119
-
120
-
121
-
122
-
123
-
124
-
125
-
126
-
127
-
128
-
129
-
130
-
131
-
132
-
133
-
134
-
135
-
136
-
137
-
138
-
139
-
140
-
141
-
142
-
143
-
144
-
145
-
146
-
147
-
148
-
149
-
150
-
151
 |
 |
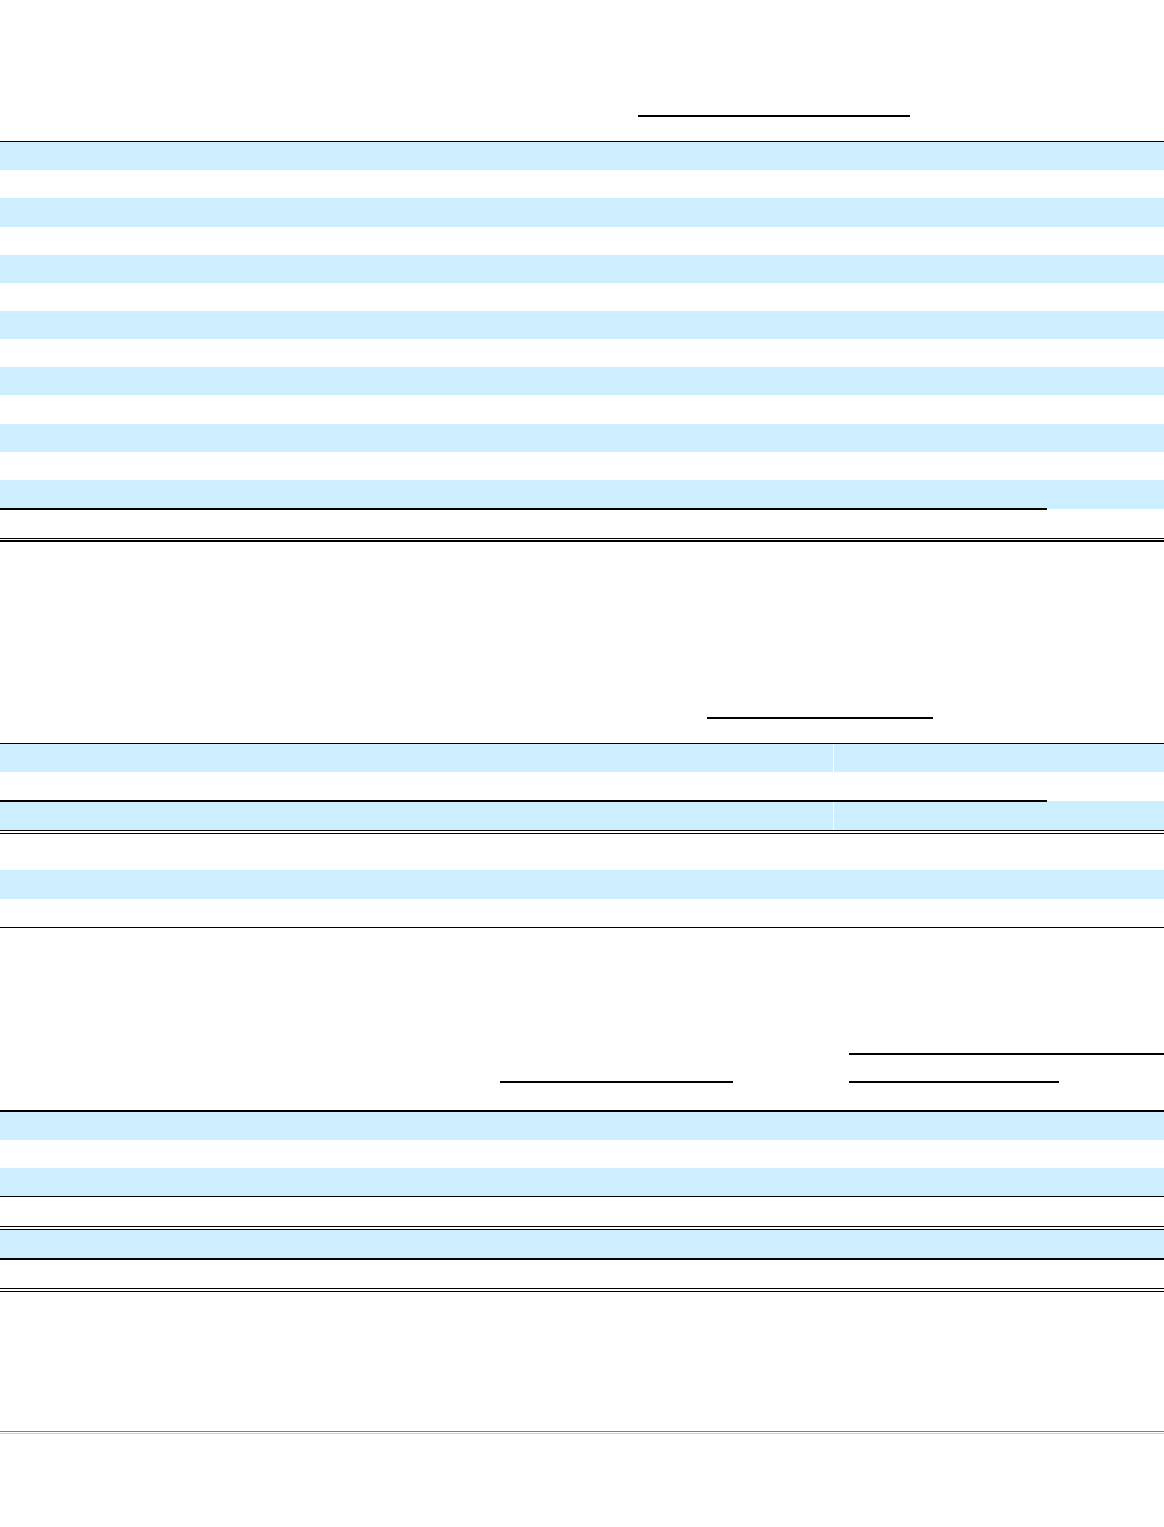
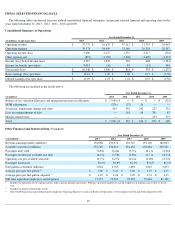
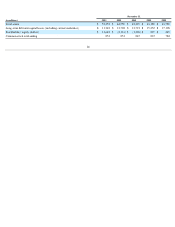
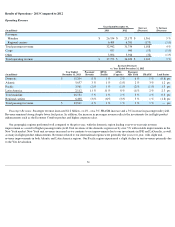
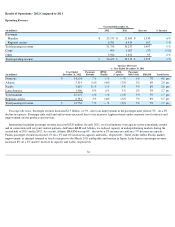
Operating Expense
(1)
NM - not meaningful. For a discussion of charges recorded in restructuring and other items, see Note 16 of the Notes to the Consolidated Financial Statements.
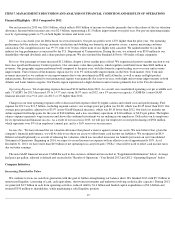
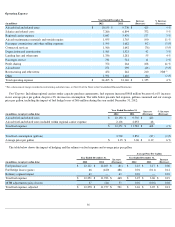
Fuel Expense. Including regional carriers under capacity purchase agreements, fuel expense decreased $787 million because of a 4%
decrease
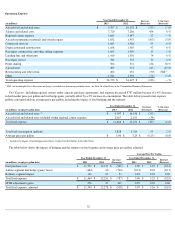
in fuel market price per gallon and fuel hedge gains, partially offset by a 2% increase in consumption. The table below presents fuel expense,
gallons consumed and our average price per gallon, including the impact of fuel hedging and the refinery:
The table below shows the impact of hedging and the refinery on fuel expense and average price per gallon, adjusted:
32
Year Ended December 31, Increase
(Decrease) % Increase
(Decrease) (in millions) 2013 2012
Aircraft fuel and related taxes
$
9,397
$
10,150
$
(753
)
(7
)%
Salaries and related costs
7,720
7,266
454
6
%
Regional carrier expense
5,669
5,647
22
—
%
Aircraft maintenance materials and outside repairs
1,852
1,955
(103
)
(5
)%
Contracted services
1,665
1,566
99
6
%
Depreciation and amortization
1,658
1,565
93
6
%
Passenger commissions and other selling expenses
1,603
1,590
13
1
%
Landing fees and other rents
1,410
1,336
74
6
%
Passenger service
762
732
30
4
%
Profit sharing
506
372
134
36
%
Aircraft rent
209
272
(63
)
(23
)%
Restructuring and other items
402
452
(50
)
NM
(1)
Other
1,520
1,592
(72
)
(5
)%
Total operating expense
$
34,373
$
34,495
$
(122
)
—
%
Year Ended December 31, Increase
(Decrease) % Increase
(Decrease) (in millions, except per gallon data) 2013 2012
Aircraft fuel and related taxes
(1)
$
9,397
$
10,150
$
(753
)
Aircraft fuel and related taxes included within regional carrier expense
2,067
2,101
(34
)
Total fuel expense
$
11,464
$
12,251
$
(787
)
(6
)%
Total fuel consumption (gallons)
3,828
3,769
59
2
%
Average price per gallon
$
3.00
$
3.25
$
(0.25
)
(8
)%
(1)
Includes the impact of fuel hedging and refinery results described further in the table below.
Average Price Per Gallon
Year Ended December 31, Increase
(Decrease)
Year Ended December 31, Increase
(Decrease) (in millions, except per gallon data) 2013 2012 2013 2012
Fuel purchase cost
$
11,792
$
12,122
$
(330
)
$
3.09
$
3.23
$
(0.14
)
Airline segment fuel hedge (gains) losses
(444
)
66
(510
)
(0.12
)
0.01
(0.13
)
Refinery segment impact
116
63
53
0.03
0.01
0.02
Total fuel expense
$
11,464
$
12,251
$
(787
)
$
3.00
$
3.25
$
(0.25
)
MTM adjustments gains
276
27
249
0.07
0.01
0.06
Total fuel expense, adjusted
$
11,740
$
12,278
$
(538
)
$
3.07
$
3.26
$
(0.19
)