Delta Airlines 2013 Annual Report Download - page 89
Download and view the complete annual report
Please find page 89 of the 2013 Delta Airlines annual report below. You can navigate through the pages in the report by either clicking on the pages listed below, or by using the keyword search tool below to find specific information within the annual report.-
 1
1 -
2
-
3
-
4
-
5
-
6
-
7
-
8
-
9
-
10
-
11
-
12
-
13
-
14
-
15
-
16
-
17
-
18
-
19
-
20
-
21
-
22
-
23
-
24
-
25
-
26
-
27
-
28
-
29
-
30
-
31
-
32
-
33
-
34
-
35
-
36
-
37
-
38
-
39
-
40
-
41
-
42
-
43
-
44
-
45
-
46
-
47
-
48
-
49
-
50
-
51
-
52
-
53
-
54
-
55
-
56
-
57
-
58
-
59
-
60
-
61
-
62
-
63
-
64
-
65
-
66
-
67
-
68
-
69
-
70
-
71
-
72
-
73
-
74
-
75
-
76
-
77
-
78
-
 79
79 -
 80
80 -
 81
81 -
 82
82 -
 83
83 -
 84
84 -
 85
85 -
 86
86 -
 87
87 -
 88
88 -
 89
89 -
 90
90 -
 91
91 -
 92
92 -
 93
93 -
 94
94 -
 95
95 -
 96
96 -
 97
97 -
 98
98 -
 99
99 -
100
-
101
-
102
-
103
-
104
-
105
-
106
-
107
-
108
-
109
-
110
-
111
-
112
-
113
-
114
-
115
-
116
-
117
-
118
-
119
-
120
-
121
-
122
-
123
-
124
-
125
-
126
-
127
-
128
-
129
-
130
-
131
-
132
-
133
-
134
-
135
-
136
-
137
-
138
-
139
-
140
-
141
-
142
-
143
-
144
-
145
-
146
-
147
-
148
-
149
-
150
-
151
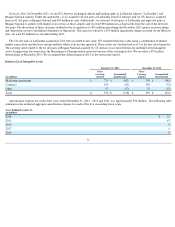
 |
 |

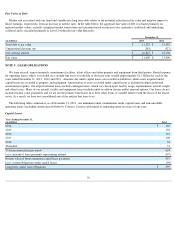
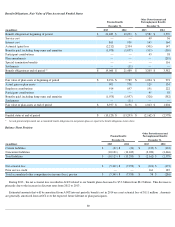
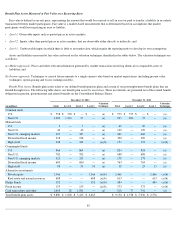
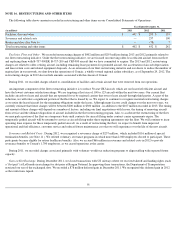
Net Periodic Cost
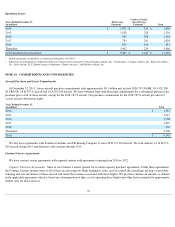
Assumptions
We used the following actuarial assumptions to determine our benefit obligations and our net periodic cost for the periods presented:
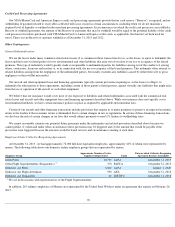
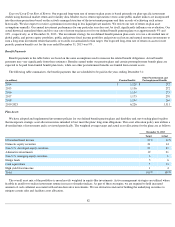
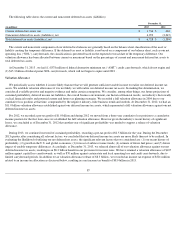
Healthcare Cost Trend Rate. Assumed healthcare cost trend rates have an effect on the amounts reported for the other postretirement benefit
plans. A 1% change in the healthcare cost trend rate used in measuring the accumulated plan benefit obligation for these plans at December 31,
2013 , would have the following effects:
81
Pension Benefits Other Postretirement and
Postemployment Benefits
Year Ended December 31, Year Ended December 31,
(in millions) 2013 2012 2011 2013 2012 2011
Service cost
$
—
$
—
$
—
$
49
$
56
$
52
Interest cost
861
930
969
143
164
180
Expected return on plan assets
(734
)
(705
)
(724
)
(84
)
(77
)
(90
)
Amortization of prior service credit
—
—
—
(
26
)
(21
)
(3
)
Recognized net actuarial loss (gain)
221
143
55
25
23
(11
)
Settlements
6
—
—
—
—
—
Special termination benefits
—
—
—
—
116
—
Net periodic cost
$
354
$
368
$
300
$
107
$
261
$
128
Defined contribution plan costs
490
426
377
—
—
—
Total cost
$
844
$
794
$
677
$
107
$
261
$
128
December 31,
Benefit Obligations
(1)(2)
2013 2012
Weighted average discount rate
5.01
%
4.11
%
Year Ended December 31,
Net Periodic Cost
(2)
2013 2012 2011
Weighted average discount rate - pension benefit
4.10
%
4.95
%
5.70
%
Weighted average discount rate - other postretirement benefit
(4)
4.00
%
4.63
%
5.55
%
Weighted average discount rate - other postemployment benefit
4.13
%
4.88
%
5.63
%
Weighted average expected long-term rate of return on plan assets
8.94
%
8.94
%
8.93
%
Assumed healthcare cost trend rate
(3)
7.00
%
7.00
%
7.00
%
(1)
Our 2013 and 2012
benefit obligations are measured using a mortality table projected to 2017 and 2016, respectively.
(2)
Future compensation levels do not impact our frozen defined benefit pension plans or other postretirement plans and impact only a small portion of our other postemployment
liability.
(3)
Assumed healthcare cost trend rate at December 31, 2013 is assumed to decline gradually to 5.00%
by 2022 and remain level thereafter.
(4)
Our assumptions reflect various remeasurements of certain portions of our obligations and represent the weighted average of the assumptions used for each measurement date.
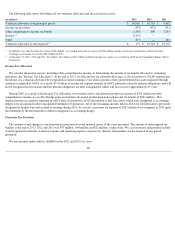
(in millions) 1% Increase 1% Decrease
Increase (decrease) in total service and interest cost
$
1
$
(1
)
Increase (decrease) in the accumulated plan benefit obligation
15
(25
)