Delta Airlines 2013 Annual Report Download - page 31
Download and view the complete annual report
Please find page 31 of the 2013 Delta Airlines annual report below. You can navigate through the pages in the report by either clicking on the pages listed below, or by using the keyword search tool below to find specific information within the annual report.-
 1
1 -
2
-
3
-
4
-
5
-
6
-
7
-
8
-
9
-
10
-
11
-
12
-
13
-
14
-
15
-
16
-
17
-
18
-
19
-
20
-
 21
21 -
 22
22 -
 23
23 -
 24
24 -
 25
25 -
 26
26 -
 27
27 -
 28
28 -
 29
29 -
 30
30 -
 31
31 -
 32
32 -
 33
33 -
 34
34 -
 35
35 -
 36
36 -
 37
37 -
 38
38 -
 39
39 -
 40
40 -
 41
41 -
42
-
43
-
44
-
45
-
46
-
47
-
48
-
49
-
50
-
51
-
52
-
53
-
54
-
55
-
56
-
57
-
58
-
59
-
60
-
61
-
62
-
63
-
64
-
65
-
66
-
67
-
68
-
69
-
70
-
71
-
72
-
73
-
74
-
75
-
76
-
77
-
78
-
79
-
80
-
81
-
82
-
83
-
84
-
85
-
86
-
87
-
88
-
89
-
90
-
91
-
92
-
93
-
94
-
95
-
96
-
97
-
98
-
99
-
100
-
101
-
102
-
103
-
104
-
105
-
106
-
107
-
108
-
109
-
110
-
111
-
112
-
113
-
114
-
115
-
116
-
117
-
118
-
119
-
120
-
121
-
122
-
123
-
124
-
125
-
126
-
127
-
128
-
129
-
130
-
131
-
132
-
133
-
134
-
135
-
136
-
137
-
138
-
139
-
140
-
141
-
142
-
143
-
144
-
145
-
146
-
147
-
148
-
149
-
150
-
151
 |
 |
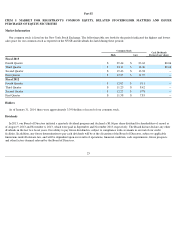
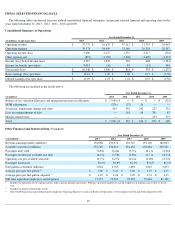
ITEM 6. SELECTED FINANCIAL DATA
The following tables are derived from our audited consolidated financial statements, and present selected financial and operating data for the
years ended
December 31, 2013 , 2012 , 2011 , 2010 and 2009 .
Consolidated Summary of Operations
The following are included in the results above:
Other Financial and Statistical Data (Unaudited)
25
Year Ended December 31,
(in millions, except share data) 2013 2012 2011 2010 2009
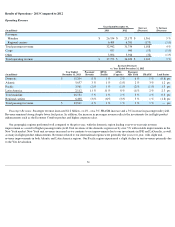
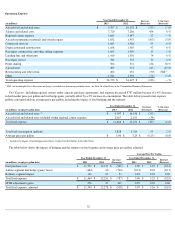
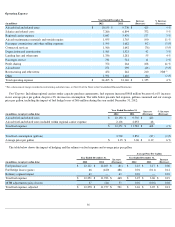
Operating revenue
$
37,773
$
36,670
$
35,115
$
31,755
$
28,063
Operating expense
34,373
34,495
33,140
29,538
28,387
Operating income (loss)
3,400
2,175
1,975
2,217
(324
)
Other expense, net
(873
)
(1,150
)
(1,206
)
(1,609
)
(1,257
)
Income (loss) before income taxes
2,527
1,025
769
608
(1,581
)
Income tax benefit (provision)
8,013
(16
)
85
(15
)
344
Net income (loss)
$
10,540
$
1,009
$
854
$
593
$
(1,237
)
Basic earnings (loss) per share
$
12.41
$
1.20
$
1.02
$
0.71
$
(1.50
)
Diluted earnings (loss) per share
$
12.29
$
1.19
$
1.01
$
0.70
$
(1.50
)
Year Ended December 31,
(in millions) 2013 2012 2011 2010 2009
Release of tax valuation allowance and intraperiod income tax allocation
$
(7,989
)
$
—
$
—
$
—
$
(
321
)
MTM adjustments
(276
)
(27
)
26
—
—
Severance, impairment charges and other
424
452
242
227
132
Loss on extinguishment of debt —
118
68
391
83
Merger-related items —
—
—
233
275
Total
$
(7,841
)
$
543
$
336
$
851
$
169
Year Ended December 31,
Consolidated
(1)
2013 2012 2011 2010 2009
Revenue passenger miles (millions)
194,988
192,974
192,767
193,169
188,943
Available seat miles (millions)
232,740
230,415
234,656
232,684
230,331
Passenger mile yield
16.89
¢
16.46
¢
15.70
¢
14.11
¢
12.60
¢
Passenger revenue per available seat mile
14.15
¢
13.78
¢
12.89
¢
11.71
¢
10.34
¢
Operating cost per available seat mile
14.77
¢
14.97
¢
14.12
¢
12.69
¢
12.32
¢
Passenger load factor
83.8
%
83.8
%
82.1
%
83.0
%
82.0
%
Fuel gallons consumed (millions)
3,828
3,769
3,856
3,823
3,853
Average price per fuel gallon
(2)
$
3.00
$
3.25
$
3.06
$
2.33
$
2.15
Average price per fuel gallon, adjusted
(3)
$
3.07
$
3.26
$
3.05
$
2.33
$
2.15
Full-time equivalent employees, end of period
77,755
73,561
78,392
79,684
81,106
(1)
Includes the operations of our regional carriers under capacity purchase agreements. Full-time equivalent employees exclude employees of regional carriers that we do not
own.
(2)
Includes the impact of fuel hedge activity.
(3)
Non
-GAAP financial measure defined and reconciled in "Operating Expense" sections of Results of Operations -
2013 compared to 2012 and 2012 compared to 2011.