Delta Airlines 2013 Annual Report Download - page 137
Download and view the complete annual report
Please find page 137 of the 2013 Delta Airlines annual report below. You can navigate through the pages in the report by either clicking on the pages listed below, or by using the keyword search tool below to find specific information within the annual report.-
 1
1 -
2
-
3
-
4
-
5
-
6
-
7
-
8
-
9
-
10
-
11
-
12
-
13
-
14
-
15
-
16
-
17
-
18
-
19
-
20
-
21
-
22
-
23
-
24
-
25
-
26
-
27
-
28
-
29
-
30
-
31
-
32
-
33
-
34
-
35
-
36
-
37
-
38
-
39
-
40
-
41
-
42
-
43
-
44
-
45
-
46
-
47
-
48
-
49
-
50
-
51
-
52
-
53
-
54
-
55
-
56
-
57
-
58
-
59
-
60
-
61
-
62
-
63
-
64
-
65
-
66
-
67
-
68
-
69
-
70
-
71
-
72
-
73
-
74
-
75
-
76
-
77
-
78
-
79
-
80
-
81
-
82
-
83
-
84
-
85
-
86
-
87
-
88
-
89
-
90
-
91
-
92
-
93
-
94
-
95
-
96
-
97
-
98
-
99
-
100
-
101
-
102
-
103
-
104
-
105
-
106
-
107
-
108
-
109
-
110
-
111
-
112
-
113
-
114
-
115
-
116
-
117
-
118
-
119
-
120
-
121
-
122
-
123
-
124
-
125
-
126
-
 127
127 -
 128
128 -
 129
129 -
 130
130 -
 131
131 -
 132
132 -
 133
133 -
 134
134 -
 135
135 -
 136
136 -
 137
137 -
 138
138 -
 139
139 -
 140
140 -
 141
141 -
 142
142 -
 143
143 -
 144
144 -
 145
145 -
 146
146 -
 147
147 -
148
-
149
-
150
-
151
 |
 |

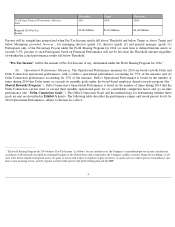
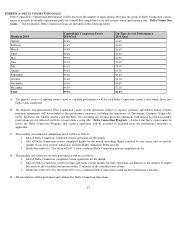
Payouts based on the Shared Rewards Program and Delta Connection Goals will be straight-
line interpolated when actual
performance results fall above Threshold and below Target or above Target and below Maximum.
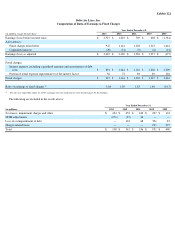
(c) Revenue Performance Measures.
The Revenue Performance measures for 2014 will be measured based on the
comparison of Delta’
s TRASM for the 2014 calendar year over the 2013 calendar year relative to the Industry Group Average
TRASM for the 2014 calendar year over the 2013 calendar year. The following table describes the performance ranges and award
payout levels for 2014 Revenue Performance, subject to Section 4(c) above:
Payouts based on Revenue Performance will be straight-
line interpolated when actual performance results fall above Threshold and
below Target or above Target and below Maximum; provided, however
, if 2014 Financial Performance equals or exceeds the
Maximum performance level, payouts based on Revenue Performance will not be less than the Target amount regardless of whether
the actual performance results fall below Target.
“ Available Seat Mile ” means the consolidated scheduled and non-
scheduled total number of seats available for
transporting passengers during a reporting period multiplied by the total number of miles flown during that period.
5
Below Threshold Threshold Target Maximum
Shared Rewards Program
% of Target Payout for this
Performance Measure (75% Weighting) 0% 37.5% 75% 150%
Number of monthly Shared Rewards
Program goals actually met during 2014
15 or less 16 21 26 or more
Delta Connection Goals
% of Target Payout for this
Performance Measure (25% Weighting) 0% 12.5% 25% 50%
Number of Delta Connection Goals
actually met during 2014 8 or less 9 14 19 or more
Threshold Target Maximum
% of Target Revenue Performance Measure Paid 50% 100% 200%
Delta's 2014 TRASM over 2013 TRASM relative to
Industry Group Average TRASM for the same
period
2013 TRASM minus 0.50%
points 2013 TRASM
2013 TRASM + 0.5% points
or more