Delta Airlines 2013 Annual Report Download - page 57
Download and view the complete annual report
Please find page 57 of the 2013 Delta Airlines annual report below. You can navigate through the pages in the report by either clicking on the pages listed below, or by using the keyword search tool below to find specific information within the annual report.-
 1
1 -
2
-
3
-
4
-
5
-
6
-
7
-
8
-
9
-
10
-
11
-
12
-
13
-
14
-
15
-
16
-
17
-
18
-
19
-
20
-
21
-
22
-
23
-
24
-
25
-
26
-
27
-
28
-
29
-
30
-
31
-
32
-
33
-
34
-
35
-
36
-
37
-
38
-
39
-
40
-
41
-
42
-
43
-
44
-
45
-
46
-
 47
47 -
 48
48 -
 49
49 -
 50
50 -
 51
51 -
 52
52 -
 53
53 -
 54
54 -
 55
55 -
 56
56 -
 57
57 -
 58
58 -
 59
59 -
 60
60 -
 61
61 -
 62
62 -
 63
63 -
 64
64 -
 65
65 -
 66
66 -
 67
67 -
68
-
69
-
70
-
71
-
72
-
73
-
74
-
75
-
76
-
77
-
78
-
79
-
80
-
81
-
82
-
83
-
84
-
85
-
86
-
87
-
88
-
89
-
90
-
91
-
92
-
93
-
94
-
95
-
96
-
97
-
98
-
99
-
100
-
101
-
102
-
103
-
104
-
105
-
106
-
107
-
108
-
109
-
110
-
111
-
112
-
113
-
114
-
115
-
116
-
117
-
118
-
119
-
120
-
121
-
122
-
123
-
124
-
125
-
126
-
127
-
128
-
129
-
130
-
131
-
132
-
133
-
134
-
135
-
136
-
137
-
138
-
139
-
140
-
141
-
142
-
143
-
144
-
145
-
146
-
147
-
148
-
149
-
150
-
151
 |
 |

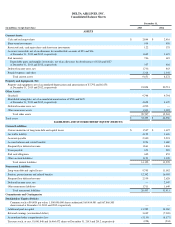
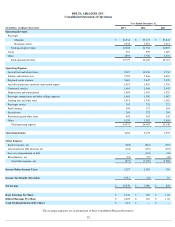
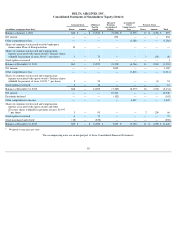
DELTA AIR LINES, INC.
Consolidated Balance Sheets
December 31,
(in millions, except share data) 2013
2012
ASSETS
Current Assets:
Cash and cash equivalents
$
2,844
$
2,416
Short-term investments
959
958
Restricted cash, cash equivalents and short-term investments
122
375
Accounts receivable, net of an allowance for uncollectible accounts of $23 and $36
at December 31, 2013 and 2012, respectively
1,609
1,693
Fuel inventory
706
619
Expendable parts and supplies inventories, net of an allowance for obsolescence of $118 and $127
at December 31, 2013 and 2012, respectively
357
404
Deferred income taxes, net
1,736
463
Prepaid expenses and other
1,318
1,344
Total current assets
9,651
8,272
Property and Equipment, Net:
Property and equipment, net of accumulated depreciation and amortization of $7,792 and $6,656
at December 31, 2013 and 2012, respectively
21,854
20,713
Other Assets:
Goodwill
9,794
9,794
Identifiable intangibles, net of accumulated amortization of $738 and $670
at December 31, 2013 and 2012, respectively
4,658
4,679
Deferred income taxes, net
4,992
—
Other noncurrent assets
1,303
1,092
Total other assets
20,747
15,565
Total assets
$
52,252
$
44,550
LIABILITIES AND STOCKHOLDERS' EQUITY (DEFICIT)
Current Liabilities:
Current maturities of long-term debt and capital leases
$
1,547
$
1,627
Air traffic liability
4,122
3,696
Accounts payable
2,300
2,293
Accrued salaries and related benefits
1,926
1,680
Frequent flyer deferred revenue
1,861
1,806
Taxes payable
673
585
Fuel card obligation
602
455
Other accrued liabilities
1,121
1,128
Total current liabilities
14,152
13,270
Noncurrent Liabilities:
Long-term debt and capital leases
9,795
11,082
Pension, postretirement and related benefits
12,392
16,005
Frequent flyer deferred revenue
2,559
2,628
Deferred income taxes, net
—
2,047
Other noncurrent liabilities
1,711
1,649
Total noncurrent liabilities
26,457
33,411
Commitments and Contingencies
Stockholders' Equity (Deficit):
Common stock at $0.0001 par value; 1,500,000,000 shares authorized, 869,484,981 and 867,866,505
shares issued at December 31, 2013 and 2012, respectively
—
—
Additional paid-in capital
13,982
14,069
Retained earnings (accumulated deficit)
3,049
(7,389
)
Accumulated other comprehensive loss
(5,130
)
(8,577
)
Treasury stock, at cost, 18,041,848 and 16,464,472 shares at December 31, 2013 and 2012, respectively
(258
)
(234
)