Delta Airlines 2013 Annual Report Download - page 36
Download and view the complete annual report
Please find page 36 of the 2013 Delta Airlines annual report below. You can navigate through the pages in the report by either clicking on the pages listed below, or by using the keyword search tool below to find specific information within the annual report.-
 1
1 -
2
-
3
-
4
-
5
-
6
-
7
-
8
-
9
-
10
-
11
-
12
-
13
-
14
-
15
-
16
-
17
-
18
-
19
-
20
-
21
-
22
-
23
-
24
-
25
-
 26
26 -
 27
27 -
 28
28 -
 29
29 -
 30
30 -
 31
31 -
 32
32 -
 33
33 -
 34
34 -
 35
35 -
 36
36 -
 37
37 -
 38
38 -
 39
39 -
 40
40 -
 41
41 -
 42
42 -
 43
43 -
 44
44 -
 45
45 -
 46
46 -
47
-
48
-
49
-
50
-
51
-
52
-
53
-
54
-
55
-
56
-
57
-
58
-
59
-
60
-
61
-
62
-
63
-
64
-
65
-
66
-
67
-
68
-
69
-
70
-
71
-
72
-
73
-
74
-
75
-
76
-
77
-
78
-
79
-
80
-
81
-
82
-
83
-
84
-
85
-
86
-
87
-
88
-
89
-
90
-
91
-
92
-
93
-
94
-
95
-
96
-
97
-
98
-
99
-
100
-
101
-
102
-
103
-
104
-
105
-
106
-
107
-
108
-
109
-
110
-
111
-
112
-
113
-
114
-
115
-
116
-
117
-
118
-
119
-
120
-
121
-
122
-
123
-
124
-
125
-
126
-
127
-
128
-
129
-
130
-
131
-
132
-
133
-
134
-
135
-
136
-
137
-
138
-
139
-
140
-
141
-
142
-
143
-
144
-
145
-
146
-
147
-
148
-
149
-
150
-
151
 |
 |

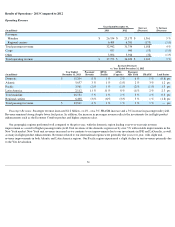
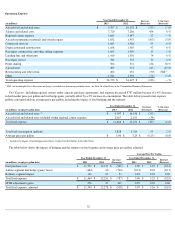
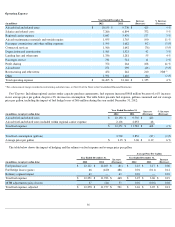
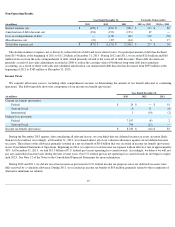
Fuel Purchase Cost. The market price per gallon of jet fuel decreased 4% , compared to 2012, which lowered our purchase cost of fuel. This
decrease was partially offset by a 2% increase in consumption on higher capacity.
Fuel Hedging Program Impact.
We actively manage our fuel price risk through a hedging program intended to reduce the financial impact on
us from changes in the price of jet fuel. During 2013, our consolidated fuel hedge gain was $493 million . This hedge gain included
$276 million
of MTM adjustments. These MTM adjustments are based on market prices as of the end of the reporting period for contracts settling in future
periods. Such market prices are not necessarily indicative of the actual future value of the underlying hedge in the contract settlement period.
Refinery Segment Impact. Global jet fuel demand continues to increase. While the advent of shale oil production in the U.S. has reduced the
threat of U.S. refinery closures beyond those that have already closed, further capacity reduction is expected in Europe, thus impacting supply in
the Atlantic Basin and ultimately increasing refinery margins in the U.S. Our wholly-owned subsidiaries, Monroe Energy, LLC and MIPC, LLC
(collectively, “Monroe”), operate the Trainer refinery and related assets located near Philadelphia, Pennsylvania as part of our strategy to
mitigate the increasing cost of the refining margin we are paying. The facilities include pipelines and terminal assets that allow the refinery to
supply jet fuel to our airline operations throughout the Northeastern U.S., including our New York hubs at LaGuardia and JFK.
The refinery produces primarily gasoline, diesel and jet fuel. Under multi-year agreements, we are effectively exchanging the non-jet fuel
products with Phillips 66 and BP for jet fuel to be used in our airline operations. The refinery produced approximately 162,000 barrels per day in
2013. The jet fuel produced and procured through exchanging gasoline and diesel fuel produced by the refinery provided approximately 150,000
barrels per day for use in airline operations during 2013.
A refinery is subject to U.S. Environmental Protection Agency ("EPA") requirements that are established each year to blend renewable fuels
into the gasoline and on-road diesel fuel it produces. Alternatively, a refinery may purchase renewable energy credits, called RINs, from third
parties in the secondary market.
Because the refinery operated by Monroe does not blend renewable fuels, it must purchase its entire RINs requirement in the secondary
market or obtain a waiver from the EPA. The refinery is exposed to the market price of RINs. For example, the average historical price of
ethanol RINs ranged from $0.02 to $0.05 per RIN in prior years, but the market price increased to over $1.40 per RIN during 2013; the price at
December 31, 2013 was $0.34 per RIN. Compliance with the RINs requirement by purchasing RINs, if available in the secondary market, at
elevated prices could have a material impact on our results of operations and cash flows for 2014. We recognized $64 million of expense related
to the RINs requirement in 2013, which is included in the refinery's results. We believe that holders of RINs have been withholding them from
the secondary market. This reduction of available RINs significantly impairs the secondary market as a means of compliance with the RINs
requirement. Therefore, the Company is pursuing legal, regulatory and legislative solutions to this problem.
The refinery recorded a loss of $116 million in 2013. The refinery's results were impacted by the cost of RINs that far exceeded their
historical averages, as discussed above. In addition, we believe that the increase in jet fuel supply due to the refinery's operation has decreased
the overall market price of jet fuel, and lowered our cost of jet fuel.
30