DIRECTV 2003 Annual Report Download - page 87
Download and view the complete annual report
Please find page 87 of the 2003 DIRECTV annual report below. You can navigate through the pages in the report by either clicking on the pages listed below, or by using the keyword search tool below to find specific information within the annual report.-
 1
1 -
2
-
3
-
4
-
5
-
6
-
7
-
8
-
9
-
10
-
11
-
12
-
13
-
14
-
15
-
16
-
17
-
18
-
19
-
20
-
21
-
22
-
23
-
24
-
25
-
26
-
27
-
28
-
29
-
30
-
31
-
32
-
33
-
34
-
35
-
36
-
37
-
38
-
39
-
40
-
41
-
42
-
43
-
44
-
45
-
46
-
47
-
48
-
49
-
50
-
51
-
52
-
53
-
54
-
55
-
56
-
57
-
58
-
59
-
60
-
61
-
62
-
63
-
64
-
65
-
66
-
67
-
68
-
69
-
70
-
71
-
72
-
73
-
74
-
75
-
76
-
 77
77 -
 78
78 -
 79
79 -
 80
80 -
 81
81 -
 82
82 -
 83
83 -
 84
84 -
 85
85 -
 86
86 -
 87
87 -
 88
88 -
 89
89 -
 90
90 -
 91
91 -
 92
92 -
 93
93 -
 94
94 -
 95
95 -
 96
96 -
 97
97 -
98
-
99
-
100
-
101
-
102
-
103
-
104
-
105
-
106
-
107
-
108
-
109
-
110
-
111
-
112
-
113
-
114
-
115
-
116
-
117
-
118
-
119
-
120
-
121
-
122
-
123
-
124
-
125
-
126
-
127
-
128
-
129
-
130
-
131
-
132
-
133
-
134
-
135
-
136
-
137
 |
 |

THE DIRECTV GROUP, INC.
NOTES TO THE CONSOLIDATED FINANCIAL STATEMENTS — (continued)
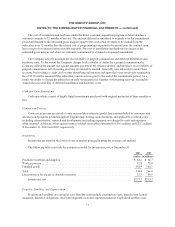
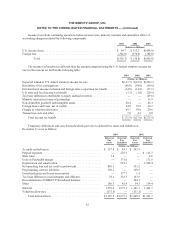
The components of the net investment in sales-type leases are as follows:
2003 2002
(Dollars in Millions)
Total minimum lease payments ............................................... $238.2 $277.6
Less unearned interest income and allowance for doubtful accounts ................... 98.5 92.8
Total net investment in sales-type leases ........................................ 139.7 184.8
Less current portion ........................................................ 23.0 22.9
Total long-term net investment in sales-type leases ............................ $116.7 $161.9
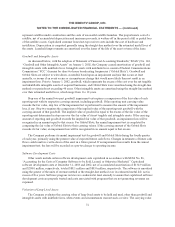
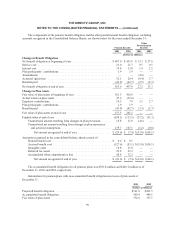
Note 5: Goodwill and Intangible Assets
The changes in the carrying amounts of goodwill by reporting unit for the years ended December 31, 2003
and 2002 were as follows:
Direct-To-
Home
Broadcast
Satellite
Services
Network
Systems Total
(Dollars in Millions)
Balance as of January 1, 2002 ................................ $3,734.0 $2,743.7 $ 18.9 $6,496.6
Impairment loss ........................................... (739.7) — (16.0) (755.7)
Additionsandother........................................ 34.8 — (0.5) 34.3
Balance as of December 31, 2002 ............................. 3,029.1 2,743.7 2.4 5,775.2
Additionsandother........................................ 2.6 4.9 0.9 8.4
Balance as of December 31, 2003 ............................. $3,031.7 $2,748.6 $ 3.3 $5,783.6
At December 31, 2003 and 2002, the Company had Orbital Slots of $432.4 million at the Direct-To-Home
Broadcast segment.
With the assistance of an independent valuation firm, the Company performed its annual impairment tests
for goodwill and Orbital Slots in the fourth quarter of 2003 and 2002. The independent valuations resulted in fair
values for each reporting unit and the Orbital Slots that exceeded the Company’s carrying values. As a result, no
impairment loss was recorded in 2003 or 2002. See “Accounting Changes” in Note 2 regarding the transitional
impairment loss recorded in 2002 as a result of the adoption of SFAS No. 142.
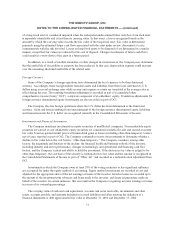
The following table sets forth the amounts recorded for intangible assets at December 31:
Estimated
Useful Lives
(years)
2003 2002
Gross
Amount
Accumulated
Amortization
Net
Amount
Gross
Amount
Accumulated
Amortization
Net
Amount
(Dollars in Millions)
Orbital Slots ...................... Indefinite $463.0 $ 30.6 $432.4 $463.0 $ 30.6 $432.4
Subscriber Base and Customer List .... 1-3 223.8 198.7 25.1 220.0 133.3 86.7
Dealer Networks .................. 12 130.0 34.6 95.4 130.0 25.4 104.6
Intangible Pension Asset ............ — 18.8 — 18.8 21.0 — 21.0
Total Intangible Assets ......... $835.6 $263.9 $571.7 $834.0 $189.3 $644.7
80