DIRECTV 2003 Annual Report Download - page 102
Download and view the complete annual report
Please find page 102 of the 2003 DIRECTV annual report below. You can navigate through the pages in the report by either clicking on the pages listed below, or by using the keyword search tool below to find specific information within the annual report.-
 1
1 -
2
-
3
-
4
-
5
-
6
-
7
-
8
-
9
-
10
-
11
-
12
-
13
-
14
-
15
-
16
-
17
-
18
-
19
-
20
-
21
-
22
-
23
-
24
-
25
-
26
-
27
-
28
-
29
-
30
-
31
-
32
-
33
-
34
-
35
-
36
-
37
-
38
-
39
-
40
-
41
-
42
-
43
-
44
-
45
-
46
-
47
-
48
-
49
-
50
-
51
-
52
-
53
-
54
-
55
-
56
-
57
-
58
-
59
-
60
-
61
-
62
-
63
-
64
-
65
-
66
-
67
-
68
-
69
-
70
-
71
-
72
-
73
-
74
-
75
-
76
-
77
-
78
-
79
-
80
-
81
-
82
-
83
-
84
-
85
-
86
-
87
-
88
-
89
-
90
-
91
-
 92
92 -
 93
93 -
 94
94 -
 95
95 -
 96
96 -
 97
97 -
 98
98 -
 99
99 -
 100
100 -
 101
101 -
 102
102 -
 103
103 -
 104
104 -
 105
105 -
 106
106 -
 107
107 -
 108
108 -
 109
109 -
 110
110 -
 111
111 -
 112
112 -
113
-
114
-
115
-
116
-
117
-
118
-
119
-
120
-
121
-
122
-
123
-
124
-
125
-
126
-
127
-
128
-
129
-
130
-
131
-
132
-
133
-
134
-
135
-
136
-
137
 |
 |

THE DIRECTV GROUP, INC.
NOTES TO THE CONSOLIDATED FINANCIAL STATEMENTS — (continued)
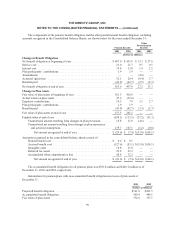
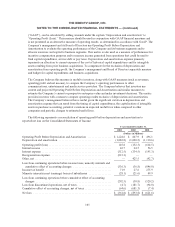
Other Comprehensive Income
The following represents changes in the components of OCI, net of taxes, as of December 31:
2003 2002 2001
Pre-tax
Amount
Tax
(Benefit)
Expense
Net
Amount
Pre-tax
Amount
Tax
Benefit
Net
Amount
Pre-tax
Amount
Tax
(Benefit)
Expense
Net
Amount
(Dollars in Millions)
Minimum pension liability adjustments . . . $ (26.8) $ (10.3) $ (16.5) $ (25.2) $(10.2) $(15.0) $(2.0) $(0.8) $(1.2)
Foreign currency translation adjustments:
Unrealized gains (losses) ........... 6.0 — 6.0 1.6 — 1.6 (60.7) — (60.7)
Less: reclassification adjustment for
net losses recognized during the
period ........................ — — — 48.9 — 48.9 — — —
Unrealized gains (losses) on securities and
derivatives:
Unrealized holding gains (losses) .... 446.8 171.5 275.3 (162.6) (65.8) (96.8) (203.2) (82.2) (121.0)
Less: reclassification adjustment for
net (gains) losses recognized during
the period ..................... (0.6) — (0.6) (162.8) (63.7) (99.1) 95.2 38.6 56.6
Note 12: Earnings (Loss) Per Common Share
Basic Earnings (Loss) Per Common Share (“EPS”) is computed by dividing net income (loss) attributable to
common stockholders by the weighted average number of common shares outstanding for the period. Income
(loss) from continuing operations before cumulative effect of accounting changes attributable to common
stockholders for each period includes income (loss) from continuing operations before cumulative effect of
accounting changes less dividends on preferred stock for the purpose of computing EPS.
Diluted EPS considers the effect of common equivalent shares, which are excluded from the computation in
loss periods as their effect would be antidilutive. The Company’s existing common equivalent shares consist
entirely of common stock options and restricted stock units issued to employees. For the year ended December
31, 2003, 91.2 million shares of common stock options and 3.6 million restricted stock units were excluded from
the calculation of diluted EPS because they were antidilutive. For the years ended December 31, 2002 and 2001,
95.1 million and 97.3 million shares of common stock options, respectively, were excluded from the calculation
of diluted EPS because they were antidilutive. Shares issuable upon conversion of the Company’s Series A
Preferred Stock were also excluded prior to the date of actual conversion because they were antidilutive.
For purposes of calculating EPS, the weighted average number of common shares outstanding is calculated
using the number of the Company’s common shares outstanding from December 23, 2003 to December 31, 2003
and the number of shares in the GM Class H Dividend Base prior to December 23, 2003. The GM Class H
Dividend Base is equal to the number of shares of GM Class H common stock which, if issued and outstanding,
would represent 100% of the tracking stock interest in the earnings of the Company.
GM Class H common stock was a “tracking stock” of GM designed to provide holders with financial returns
based on the financial performance of the Company. Holders of GM Class H common stock had no direct rights
in the equity or assets of the Company, but rather had rights in the equity and assets of GM (which included
100% of the stock of the Company).
95