DIRECTV 2003 Annual Report Download - page 127
Download and view the complete annual report
Please find page 127 of the 2003 DIRECTV annual report below. You can navigate through the pages in the report by either clicking on the pages listed below, or by using the keyword search tool below to find specific information within the annual report.-
 1
1 -
2
-
3
-
4
-
5
-
6
-
7
-
8
-
9
-
10
-
11
-
12
-
13
-
14
-
15
-
16
-
17
-
18
-
19
-
20
-
21
-
22
-
23
-
24
-
25
-
26
-
27
-
28
-
29
-
30
-
31
-
32
-
33
-
34
-
35
-
36
-
37
-
38
-
39
-
40
-
41
-
42
-
43
-
44
-
45
-
46
-
47
-
48
-
49
-
50
-
51
-
52
-
53
-
54
-
55
-
56
-
57
-
58
-
59
-
60
-
61
-
62
-
63
-
64
-
65
-
66
-
67
-
68
-
69
-
70
-
71
-
72
-
73
-
74
-
75
-
76
-
77
-
78
-
79
-
80
-
81
-
82
-
83
-
84
-
85
-
86
-
87
-
88
-
89
-
90
-
91
-
92
-
93
-
94
-
95
-
96
-
97
-
98
-
99
-
100
-
101
-
102
-
103
-
104
-
105
-
106
-
107
-
108
-
109
-
110
-
111
-
112
-
113
-
114
-
115
-
116
-
 117
117 -
 118
118 -
 119
119 -
 120
120 -
 121
121 -
 122
122 -
 123
123 -
 124
124 -
 125
125 -
 126
126 -
 127
127 -
 128
128 -
 129
129 -
 130
130 -
 131
131 -
 132
132 -
 133
133 -
 134
134 -
 135
135 -
 136
136 -
 137
137
 |
 |

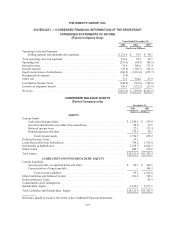
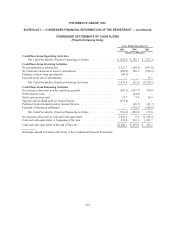
THE DIRECTV GROUP, INC.
SCHEDULE I — CONDENSED FINANCIAL INFORMATION OF THE REGISTRANT — (continued)
CONDENSED STATEMENTS OF CASH FLOWS
(Parent Company Only)
Years Ended December 31,
2003 2002 2001
(Dollars in Millions)
Cash Flows from Operating Activities
Net Cash Provided by (Used in) Operating Activities ................. $ (268.7) $ 542.3 $ (232.3)
Cash Flows from Investing Activities
Net investments in subsidiaries ....................................... 2,221.7 (160.5) (997.0)
Net (increase) decrease in loans to subsidiaries .......................... (108.0) 108.3 (194.2)
Purchase of short term investments .................................... (40.3) — —
Proceeds from sale of investments .................................... — — 71.1
Net Cash Provided by (Used in) Investing Activities .................. 2,073.4 (52.2) (1,120.1)
Cash Flows from Financing Activities
Net increase (decrease) in notes and loans payable ........................ (506.3) (243.7) 750.0
Debt issuance costs ................................................ — (44.0) —
Stock options exercised ............................................. 17.7 7.4 14.5
Special cash dividend paid to General Motors ........................... (275.0) — —
Preferred stock dividends paid to General Motors ........................ — (68.7) (93.7)
Payment of Raytheon settlement ...................................... — (134.2) (500.0)
Net Cash Provided by (Used in) Financing Activities ................. (763.6) (483.2) 170.8
Net increase (decrease) in cash and cash equivalents ...................... 1,041.1 6.9 (1,181.6)
Cash and cash equivalents at beginning of the year ....................... 239.0 232.1 1,413.7
Cash and cash equivalents at the end of the year ......................... $1,280.1 $ 239.0 $ 232.1
Reference should be made to the Notes to the Condensed Financial Statements.
120