DIRECTV 2003 Annual Report Download - page 49
Download and view the complete annual report
Please find page 49 of the 2003 DIRECTV annual report below. You can navigate through the pages in the report by either clicking on the pages listed below, or by using the keyword search tool below to find specific information within the annual report.-
 1
1 -
2
-
3
-
4
-
5
-
6
-
7
-
8
-
9
-
10
-
11
-
12
-
13
-
14
-
15
-
16
-
17
-
18
-
19
-
20
-
21
-
22
-
23
-
24
-
25
-
26
-
27
-
28
-
29
-
30
-
31
-
32
-
33
-
34
-
35
-
36
-
37
-
38
-
 39
39 -
 40
40 -
 41
41 -
 42
42 -
 43
43 -
 44
44 -
 45
45 -
 46
46 -
 47
47 -
 48
48 -
 49
49 -
 50
50 -
 51
51 -
 52
52 -
 53
53 -
 54
54 -
 55
55 -
 56
56 -
 57
57 -
 58
58 -
 59
59 -
60
-
61
-
62
-
63
-
64
-
65
-
66
-
67
-
68
-
69
-
70
-
71
-
72
-
73
-
74
-
75
-
76
-
77
-
78
-
79
-
80
-
81
-
82
-
83
-
84
-
85
-
86
-
87
-
88
-
89
-
90
-
91
-
92
-
93
-
94
-
95
-
96
-
97
-
98
-
99
-
100
-
101
-
102
-
103
-
104
-
105
-
106
-
107
-
108
-
109
-
110
-
111
-
112
-
113
-
114
-
115
-
116
-
117
-
118
-
119
-
120
-
121
-
122
-
123
-
124
-
125
-
126
-
127
-
128
-
129
-
130
-
131
-
132
-
133
-
134
-
135
-
136
-
137
 |
 |

THE DIRECTV GROUP, INC.
Direct-To-Home Broadcast Segment
The following table provides the significant components of the Direct-To-Home Broadcast segment
operating results for the years ended December 31:
Change
2002 2001 $ %
(Dollars in Millions)
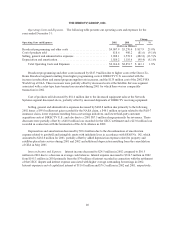
Revenues
DIRECTVU.S. .............................................. $6,444.6 $5,552.2 $892.4 16.1%
DIRECTV Latin America ...................................... 679.7 727.0 (47.3) (6.5)%
Operating Profit (Loss) Before Depreciation &
Amortization
DIRECTVU.S. .............................................. $ 608.8 $ 219.8 $389.0 177.0%
DIRECTV Latin America ...................................... (201.9) (131.5) (70.4) (53.5)%
Operating Profit (Loss)
DIRECTVU.S. .............................................. $ 203.2 $ (218.7) $421.9 192.9%
DIRECTV Latin America ...................................... (415.1) (330.7) (84.4) (25.5)%
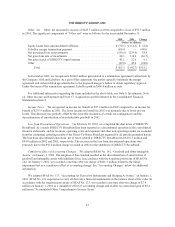
United States. The increase in revenues resulted primarily from the addition of new subscribers in 2002
and higher ARPU on the larger subscriber base. A summary of DIRECTV U.S.’ subscriber data for the years
ended December 31 is as follows:
2002 2001 Change
Owned and operated subscribers (000’s) .............................. 9,493 8,443 1,050
NRTC subscribers (000’s) ......................................... 1,683 1,892 (209)
Total number of subscribers (000’s) ............................. 11,176 10,335 841
Net owned and operated subscriber additions (000’s) .................... 1,050 1,168 (118)
ARPU......................................................... $ 59.80 $ 58.70 $ 1.10
Average monthly subscriber churn % ................................ 1.6% 1.8% (0.2)%
Average subscriber acquisition costs—per subscriber (SAC) .............. $ 540 $ 570 $ (30)
The increase in ARPU of $1.10 resulted primarily from expanded local channel offerings, higher revenues
from seasonal and live sporting events and other subscriber revenues, such as revenues from an increased number
of subscribers with multiple set-top receivers. The decrease in average monthly churn was due to an increase in
the number of new subscribers signing up for 12 month programming commitments, improved customer service
and more stringent credit screening practices for new customers.
The increase in operating profit before depreciation and amortization was primarily attributable to the
additional profit resulting from the higher revenues discussed above, lower total subscriber acquisition costs and
a $48.0 million charge primarily related to severance costs recorded in 2001. These improvements were partially
offset by higher subscriber service expenses and the loss recorded for the GECC dispute.
The change in operating loss was due to the increased operating profit before depreciation and amortization
and lower amortization expense of $128.8 million that resulted from the adoption of SFAS No. 142, partially
offset by a $91 million increase in depreciation expense related to property and satellites placed in service during
2002 and 2001.
Latin America. The 6.5% decline in revenues resulted from the devaluation of certain foreign currencies,
the most significant of which was in Argentina, and lower 2002 subscribers, partially offset by $55.0 million of
42