DIRECTV 2003 Annual Report Download - page 46
Download and view the complete annual report
Please find page 46 of the 2003 DIRECTV annual report below. You can navigate through the pages in the report by either clicking on the pages listed below, or by using the keyword search tool below to find specific information within the annual report.-
 1
1 -
2
-
3
-
4
-
5
-
6
-
7
-
8
-
9
-
10
-
11
-
12
-
13
-
14
-
15
-
16
-
17
-
18
-
19
-
20
-
21
-
22
-
23
-
24
-
25
-
26
-
27
-
28
-
29
-
30
-
31
-
32
-
33
-
34
-
35
-
 36
36 -
 37
37 -
 38
38 -
 39
39 -
 40
40 -
 41
41 -
 42
42 -
 43
43 -
 44
44 -
 45
45 -
 46
46 -
 47
47 -
 48
48 -
 49
49 -
 50
50 -
 51
51 -
 52
52 -
 53
53 -
 54
54 -
 55
55 -
 56
56 -
57
-
58
-
59
-
60
-
61
-
62
-
63
-
64
-
65
-
66
-
67
-
68
-
69
-
70
-
71
-
72
-
73
-
74
-
75
-
76
-
77
-
78
-
79
-
80
-
81
-
82
-
83
-
84
-
85
-
86
-
87
-
88
-
89
-
90
-
91
-
92
-
93
-
94
-
95
-
96
-
97
-
98
-
99
-
100
-
101
-
102
-
103
-
104
-
105
-
106
-
107
-
108
-
109
-
110
-
111
-
112
-
113
-
114
-
115
-
116
-
117
-
118
-
119
-
120
-
121
-
122
-
123
-
124
-
125
-
126
-
127
-
128
-
129
-
130
-
131
-
132
-
133
-
134
-
135
-
136
-
137
 |
 |

THE DIRECTV GROUP, INC.
The increase in revenues resulted from higher sales of DIRECTV set-top receivers, which totaled about 3.6
million units in 2003 compared to about 2.6 million units in 2002, and higher revenues from the enterprise and
residential DIRECWAY businesses. As of December 31, 2003, DIRECWAY had approximately 180,000
residential subscribers in North America compared to approximately 133,000 as of December 31, 2002.
The improvement in operating loss before depreciation and amortization and operating loss resulted
primarily from a lower loss in the residential DIRECWAY business due to improved efficiencies associated with
the larger subscriber base and a provision for inventory and severance costs totaling $15.0 million in 2002,
partially offset by a $24.5 million gain in 2002 resulting from the recovery of receivables written-off in 1999.
Eliminations and Other
The elimination of revenues increased to $323.7 million in 2003 from $240.6 million in 2002. The increase
was primarily due to increased shipments of DIRECTV receiving equipment from the Network Systems segment to
the Direct-To-Home Broadcast segment, partially offset by a decrease in satellite transponder leasing revenues from
the Satellite Services segment to the Direct-To-Home Broadcast segment. Until the sale of the assets of HGS to
PanAmSat on March 7, 2003, HGS’ revenues were recorded in Eliminations and Other. During 2002, the
elimination of revenues was partially offset by HGS revenues of $52.3 million, as compared with $15.3 million in
revenues in 2003 prior to the March 7, 2003 sale.
Operating loss from Eliminations and Other increased to an operating loss of $246.5 million in 2003 from
an operating loss of $44.9 million in 2002. The increase resulted primarily from the one-time charge of
approximately $132 million in 2003 related to the completion of the News Corporation transactions and a $95.0
million net gain recorded in 2002 for the NASA claim, partially offset by the $23.0 million loss recorded in
connection with the termination of the AOL alliance in 2002.
2002 Compared To 2001
Consolidated
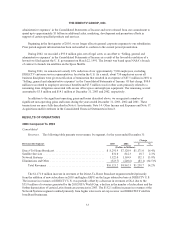
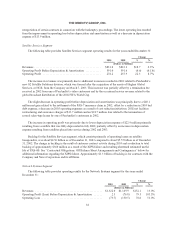
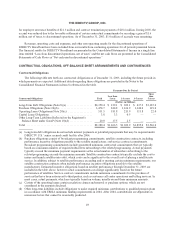
Revenues. The following table presents our revenues, by segment, for the years ended December 31:
Change
Revenues By Segment: 2002 2001 $ %
(Dollars in Millions)
Direct-To-Home Broadcast .................................... $7,120.9 $6,279.6 $ 841.3 13.4%
Satellite Services ............................................ 812.3 870.1 (57.8) (6.6)%
Network Systems ............................................ 1,169.9 1,325.8 (155.9) (11.8)%
EliminationsandOther........................................ (240.6) (238.3) (2.3) (1.0)%
TotalRevenues .......................................... $8,862.5 $8,237.2 $ 625.3 7.6%
The increase in revenues resulted primarily from higher revenues at the Direct-To-Home Broadcast segment
from the addition of new subscribers in 2002 and higher ARPU at DIRECTV U.S. The increase in revenues from
the Direct-To-Home Broadcast segment were partially offset by a decrease in revenues at the Network Systems
segment resulting from the substantial completion in late 2001 of two significant customer contracts for the sale
of phones and systems for mobile satellite programs. In addition, the decrease in revenues at the Satellite
Services segment was primarily due to a sales-type lease transaction executed during 2001 for which there was
no comparable transaction in 2002.
39