DIRECTV 2003 Annual Report Download - page 32
Download and view the complete annual report
Please find page 32 of the 2003 DIRECTV annual report below. You can navigate through the pages in the report by either clicking on the pages listed below, or by using the keyword search tool below to find specific information within the annual report.-
 1
1 -
2
-
3
-
4
-
5
-
6
-
7
-
8
-
9
-
10
-
11
-
12
-
13
-
14
-
15
-
16
-
17
-
18
-
19
-
20
-
21
-
 22
22 -
 23
23 -
 24
24 -
 25
25 -
 26
26 -
 27
27 -
 28
28 -
 29
29 -
 30
30 -
 31
31 -
 32
32 -
 33
33 -
 34
34 -
 35
35 -
 36
36 -
 37
37 -
 38
38 -
 39
39 -
 40
40 -
 41
41 -
 42
42 -
43
-
44
-
45
-
46
-
47
-
48
-
49
-
50
-
51
-
52
-
53
-
54
-
55
-
56
-
57
-
58
-
59
-
60
-
61
-
62
-
63
-
64
-
65
-
66
-
67
-
68
-
69
-
70
-
71
-
72
-
73
-
74
-
75
-
76
-
77
-
78
-
79
-
80
-
81
-
82
-
83
-
84
-
85
-
86
-
87
-
88
-
89
-
90
-
91
-
92
-
93
-
94
-
95
-
96
-
97
-
98
-
99
-
100
-
101
-
102
-
103
-
104
-
105
-
106
-
107
-
108
-
109
-
110
-
111
-
112
-
113
-
114
-
115
-
116
-
117
-
118
-
119
-
120
-
121
-
122
-
123
-
124
-
125
-
126
-
127
-
128
-
129
-
130
-
131
-
132
-
133
-
134
-
135
-
136
-
137
 |
 |

THE DIRECTV GROUP, INC.
SUMMARY DATA — (continued)
Years Ended December 31,
2003 2002 2001
(Dollars in Millions)
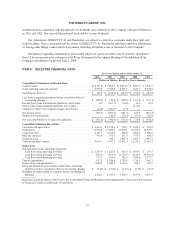
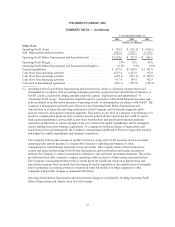
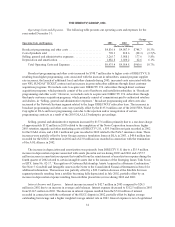
Other Data:
Operating Profit (Loss) ........................................ $ 145.8 $ (152.3) $ (614.5)
Add: Depreciation and amortization .............................. 1,082.8 1,020.2 1,110.6
Operating Profit Before Depreciation and Amortization(1) ............ $1,228.6 $ 867.9 $ 496.1
Operating Profit Margin ....................................... 1.4% N/A N/A
Operating Profit Before Depreciation and Amortization Margin(1) ...... 12.1% 9.8% 6.0%
Capital expenditures .......................................... $ 857.8 $1,244.0 $ 1,702.8
Cash flows from operating activities .............................. 1,275.4 1,227.0 332.0
Cash flows from investing activities .............................. (629.1) (833.1) (1,700.5)
Cash flows from financing activities .............................. 917.9 189.6 742.9
Cash used in discontinued operations ............................. (429.5) (155.0) (182.4)
(1) Operating Profit (Loss) Before Depreciation and Amortization, which is a financial measure that is not
determined in accordance with accounting principles generally accepted in the United States of America, or
GAAP, can be calculated by adding amounts under the caption “Depreciation and amortization” to
“Operating Profit (Loss).” This measure should be used in conjunction with GAAP financial measures and
is not presented as an alternative measure of operating results, as determined in accordance with GAAP. The
Company’s management and its Board of Directors use Operating Profit Before Depreciation and
Amortization to evaluate the operating performance of the Company and its business segments and to
allocate resources and capital to business segments. This metric is also used as a measure of performance for
incentive compensation purposes and to measure income generated from operations that could be used to
fund capital expenditures, service debt or pay taxes. Depreciation and amortization expense primarily
represents an allocation to current expense of the cost of historical capital expenditures and for intangible
assets resulting from prior business acquisitions. To compensate for the exclusion of depreciation and
amortization from operating profit, the Company’s management and Board of Directors separately measure
and budget for capital expenditures and business acquisitions.
The Company believes this measure is useful to investors, along with GAAP measures (such as revenues,
operating profit and net income), to compare the Company’s operating performance to other
communication, entertainment and media service providers. The Company believes that investors use
current and projected Operating Profit Before Depreciation and Amortization and similar measures to
estimate the Company’s current or prospective enterprise value and make investment decisions. This metric
provides investors with a means to compare operating results exclusive of depreciation and amortization.
The Company’s management believes this is useful given the significant variation in depreciation and
amortization expense that can result from the timing of capital expenditures, the capitalization of intangible
assets in purchase accounting, potential variations in expected useful lives when compared to other
companies and periodic changes to estimated useful lives.
Operating Profit Before Depreciation and Amortization Margin is calculated by dividing Operating Profit
Before Depreciation and Amortization by total revenues.
25