DIRECTV 2003 Annual Report Download - page 45
Download and view the complete annual report
Please find page 45 of the 2003 DIRECTV annual report below. You can navigate through the pages in the report by either clicking on the pages listed below, or by using the keyword search tool below to find specific information within the annual report.-
 1
1 -
2
-
3
-
4
-
5
-
6
-
7
-
8
-
9
-
10
-
11
-
12
-
13
-
14
-
15
-
16
-
17
-
18
-
19
-
20
-
21
-
22
-
23
-
24
-
25
-
26
-
27
-
28
-
29
-
30
-
31
-
32
-
33
-
34
-
 35
35 -
 36
36 -
 37
37 -
 38
38 -
 39
39 -
 40
40 -
 41
41 -
 42
42 -
 43
43 -
 44
44 -
 45
45 -
 46
46 -
 47
47 -
 48
48 -
 49
49 -
 50
50 -
 51
51 -
 52
52 -
 53
53 -
 54
54 -
 55
55 -
56
-
57
-
58
-
59
-
60
-
61
-
62
-
63
-
64
-
65
-
66
-
67
-
68
-
69
-
70
-
71
-
72
-
73
-
74
-
75
-
76
-
77
-
78
-
79
-
80
-
81
-
82
-
83
-
84
-
85
-
86
-
87
-
88
-
89
-
90
-
91
-
92
-
93
-
94
-
95
-
96
-
97
-
98
-
99
-
100
-
101
-
102
-
103
-
104
-
105
-
106
-
107
-
108
-
109
-
110
-
111
-
112
-
113
-
114
-
115
-
116
-
117
-
118
-
119
-
120
-
121
-
122
-
123
-
124
-
125
-
126
-
127
-
128
-
129
-
130
-
131
-
132
-
133
-
134
-
135
-
136
-
137
 |
 |

THE DIRECTV GROUP, INC.
renegotiation of certain contracts in connection with the bankruptcy proceedings. The lower operating loss resulted
from the improvement in operating loss before depreciation and amortization as well as a decrease in depreciation
expense of $13.9 million.
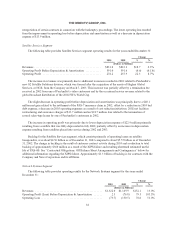
Satellite Services Segment
The following table provides Satellite Services segment operating results for the years ended December 31:
Change
2003 2002 $ %
(Dollars in Millions)
Revenues............................................... $831.0 $812.3 $18.7 2.3%
Operating Profit Before Depreciation & Amortization ........... 591.0 591.6 (0.6) (0.1)%
Operating Profit ......................................... 278.2 255.9 22.3 8.7%
The increase in revenues was primarily due to additional revenues recorded in 2003 related to PanAmSat’s
new G2 Satellite Solutions division, which was formed after the acquisition of the assets of Hughes Global
Services, or HGS, from the Company on March 7, 2003. This increase was partially offset by a termination fee
received in 2002 from one of PanAmSat’s video customers and by the occasional service revenue related to the
global broadcast distribution of the 2002 FIFA World Cup.
The slight decrease in operating profit before depreciation and amortization was principally due to a $40.1
million net gain related to the settlement of the PAS-7 insurance claim in 2002, offset by a reduction in 2003 bad
debt expense, a decrease in 2003 operating expenses as a result of cost reduction initiatives, 2002 net facilities
restructuring and severance charges of $13.7 million and an $18.7 million loss related to the termination of
several sales-type leases by one of PanAmSat’s customers in 2002.
The increase in operating profit was primarily due to lower depreciation expense of $22.9 million primarily
resulting from a satellite that was fully depreciated in July 2002, partially offset by an increase in depreciation
expense resulting from satellites placed into service during 2002 and 2003.
Backlog for the Satellite Services segment, which consists primarily of operating leases on satellite
transponders, was about $4.56 billion as of December 31, 2003 compared to about $5.55 billion as of December
31, 2002. The change in backlog is the result of customer contract activity during 2003 and a reduction to total
backlog of approximately $360 million as a result of the XIPS failure and resulting shortened estimated useful
life of PAS-6B. See “Contractual Obligations, Off Balance Sheet Arrangements and Contingencies” below for
additional information regarding the XIPS failure. Approximately $1.3 billion of backlog is for contracts with the
Company and News Corporation and its affiliates.
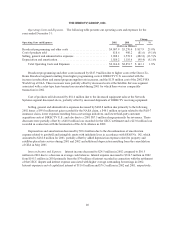
Network Systems Segment
The following table provides operating results for the Network Systems segment for the years ended
December 31:
Change
2003 2002 $ %
(Dollars in Millions)
Revenues ............................................... $1,322.0 $1,169.9 $152.1 13.0%
Operating Profit (Loss) Before Depreciation & Amortization ...... 2.5 (76.8) 79.3 103.3%
Operating Loss ........................................... (73.7) (150.5) 76.8 51.0%
38