DIRECTV 2003 Annual Report Download - page 30
Download and view the complete annual report
Please find page 30 of the 2003 DIRECTV annual report below. You can navigate through the pages in the report by either clicking on the pages listed below, or by using the keyword search tool below to find specific information within the annual report.-
 1
1 -
2
-
3
-
4
-
5
-
6
-
7
-
8
-
9
-
10
-
11
-
12
-
13
-
14
-
15
-
16
-
17
-
18
-
19
-
 20
20 -
 21
21 -
 22
22 -
 23
23 -
 24
24 -
 25
25 -
 26
26 -
 27
27 -
 28
28 -
 29
29 -
 30
30 -
 31
31 -
 32
32 -
 33
33 -
 34
34 -
 35
35 -
 36
36 -
 37
37 -
 38
38 -
 39
39 -
 40
40 -
41
-
42
-
43
-
44
-
45
-
46
-
47
-
48
-
49
-
50
-
51
-
52
-
53
-
54
-
55
-
56
-
57
-
58
-
59
-
60
-
61
-
62
-
63
-
64
-
65
-
66
-
67
-
68
-
69
-
70
-
71
-
72
-
73
-
74
-
75
-
76
-
77
-
78
-
79
-
80
-
81
-
82
-
83
-
84
-
85
-
86
-
87
-
88
-
89
-
90
-
91
-
92
-
93
-
94
-
95
-
96
-
97
-
98
-
99
-
100
-
101
-
102
-
103
-
104
-
105
-
106
-
107
-
108
-
109
-
110
-
111
-
112
-
113
-
114
-
115
-
116
-
117
-
118
-
119
-
120
-
121
-
122
-
123
-
124
-
125
-
126
-
127
-
128
-
129
-
130
-
131
-
132
-
133
-
134
-
135
-
136
-
137
 |
 |

THE DIRECTV GROUP, INC.
dividend paid in connection with the split-off, no dividends were declared by the Company’s Board of Directors
in 2003 and 2002. The convertible preferred stock did not accrue dividends.
Our subsidiaries, DIRECTV U.S. and PanAmSat, are subject to restrictive covenants under their debt and
credit facilities. These covenants limit the ability of DIRECTV U.S., PanAmSat and their respective subsidiaries
to, among other things, make restricted payments, including dividends, loans or advances to the Company.
Information regarding compensation plans under which our equity securities may be issued is included in
Item 12 by incorporation by reference to the Proxy Statement for the Annual Meeting of Stockholders of the
Company scheduled to be held on June 2, 2004.
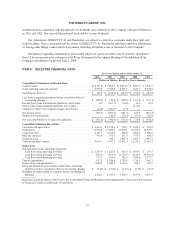
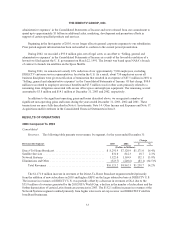
ITEM 6. SELECTED FINANCIAL DATA
For Years Ended and As of December 31,
2003 2002 2001 2000 1999
(Dollars in Millions, Except Per Share Amounts)
Consolidated Statements of Income Data:
Total revenues ........................................ $10,121.2 $ 8,862.5 $ 8,237.2 $ 7,287.6 $ 5,560.3
Total operating costs and expenses ........................ 9,975.4 9,014.8 8,851.7 7,641.7 5,974.8
Operating profit (loss) .................................. $ 145.8 $ (152.3) $ (614.5) $ (354.1) $ (414.5)
Loss from continuing operations before cumulative effect of
accounting changes .................................. $ (292.5) $ (30.8) $ (520.2) $ (355.4) $ (391.1)
Income (loss) from discontinued operations, net of taxes ....... (4.7) (181.7) (94.0) 36.1 99.8
Gain on sale of discontinued operations, net of taxes ..........———1,132.3 —
Cumulative effect of accounting changes, net of taxes ......... (64.6) (681.3) (7.4) — —
Net income (loss) ...................................... (361.8) (893.8) (621.6) 813.0 (291.3)
Preferred stock dividends ................................ — (46.9) (96.4) (97.0) (50.9)
Net Loss Attributable to Common Stockholders .............. $ (361.8) $ (940.7) $ (718.0) $ 716.0 $ (342.2)
Consolidated Balance Sheet Data:
Cash and cash equivalents ............................... $ 2,263.3 $ 1,128.6 $ 700.1 $ 1,508.1 $ 238.2
Total assets ........................................... 18,954.2 17,885.1 19,210.1 19,279.3 18,597.0
Long-term debt ....................................... 4,131.3 2,390.0 988.8 1,292.0 1,586.0
Minority interests ...................................... 592.4 555.3 531.3 553.7 544.3
Preferred stock ........................................ — 914.1 1,498.4 1,495.7 1,487.5
Total stockholders’ equity ............................... 9,631.1 9,977.1 11,071.9 12,326.1 11,681.3
Other Data:
Net cash flows from continuing operations:
Cash flows from operating activities ..................... $ 1,275.4 $ 1,227.0 $ 332.0 $ 1,090.7 $ 379.5
Cash flows from investing activities ..................... (629.1) (833.1) (1,700.5) 2,210.8 (3,941.8)
Cash flows from financing activities ..................... 917.9 189.6 742.9 (849.6) 2,577.5
Capital expenditures ................................... 857.8 1,244.0 1,702.8 1,716.1 1,665.3
Depreciation and amortization ............................ 1,082.8 1,020.2 1,110.6 948.1 678.9
Basic and diluted loss per common share from continuing
operations before cumulative effect of accounting changes . . . $ (0.21) $ (0.06) $ (0.47) $ (0.35) $ (0.35)
Weighted average number of common shares outstanding (in
millions) ........................................... 1,382.5 1,343.1 1,300.0 1,297.0 1,255.5
Reference should be made to the Notes to the Consolidated Financial Statements and Management’s Discussion and Analysis
of Financial Condition and Results of Operations.
23