DIRECTV 2003 Annual Report Download - page 3
Download and view the complete annual report
Please find page 3 of the 2003 DIRECTV annual report below. You can navigate through the pages in the report by either clicking on the pages listed below, or by using the keyword search tool below to find specific information within the annual report.-
 1
1 -
 2
2 -
 3
3 -
 4
4 -
 5
5 -
 6
6 -
 7
7 -
 8
8 -
 9
9 -
 10
10 -
 11
11 -
 12
12 -
 13
13 -
 14
14 -
15
-
16
-
17
-
18
-
19
-
20
-
21
-
22
-
23
-
24
-
25
-
26
-
27
-
28
-
29
-
30
-
31
-
32
-
33
-
34
-
35
-
36
-
37
-
38
-
39
-
40
-
41
-
42
-
43
-
44
-
45
-
46
-
47
-
48
-
49
-
50
-
51
-
52
-
53
-
54
-
55
-
56
-
57
-
58
-
59
-
60
-
61
-
62
-
63
-
64
-
65
-
66
-
67
-
68
-
69
-
70
-
71
-
72
-
73
-
74
-
75
-
76
-
77
-
78
-
79
-
80
-
81
-
82
-
83
-
84
-
85
-
86
-
87
-
88
-
89
-
90
-
91
-
92
-
93
-
94
-
95
-
96
-
97
-
98
-
99
-
100
-
101
-
102
-
103
-
104
-
105
-
106
-
107
-
108
-
109
-
110
-
111
-
112
-
113
-
114
-
115
-
116
-
117
-
118
-
119
-
120
-
121
-
122
-
123
-
124
-
125
-
126
-
127
-
128
-
129
-
130
-
131
-
132
-
133
-
134
-
135
-
136
-
137
 |
 |

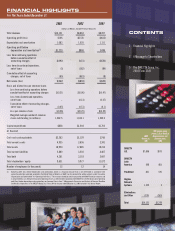
CONTENTS
1 Financial Highlights
2 A Message to Shareholders
5 The DIRECTV Group, Inc.
2003 Form 10-K
DIRECTV
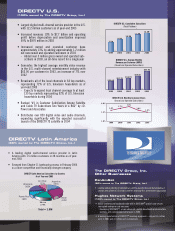
U.S.
DIRECTV
Latin
America
PanAmSat
Hughes
Network
Systems
Eliminations
and Other
Total
$7,696
598
831
1,322
(326)
$10,121
$970
(85)
591
3
(250)
$1,229
2003
Revenues
($M)
FINANCIAL HIGHLIGHTS
For The Years Ended December 31,
2003 2002 2001
(Dollars in Millions, Except Per Share Amounts)
Total revenues $10,121 $8,863 $8,237
Operating profit (loss) $146 $(152) $(615)
Depreciation and amortization 1,083 1,020 1,111
Operating profit before
depreciation and amortization(1) $1,229 $868 $496
Loss from continuing operations
before cumulative effect of
accounting changes $(292) $(31) $(520)
Loss from discontinued operations,
net of taxes (5) (182) (94)
Cumulative effect of accounting
changes, net of taxes (65) (681) (8)
Net income (loss) $(362) $(894) $(622)
Basic and diluted loss per common share:
Loss from continuing operations before
cumulative effect of accounting changes $(0.21) $(0.06) $(0.47)
Loss from discontinued operations,
net of taxes – (0.13) (0.07)
Cumulative effect of accounting changes,
net of taxes (0.05) (0.51) (0.1)
Loss per common share $(0.26) $(0.70) $(0.55)
Weighted average number of common
shares outstanding (in millions) 1,382.5 1,343.1 1,300.0
Capital expenditures $858 $1,244 $1,703
At Year-End
Cash and cash equivalents $2,263 $1,129 $700
Total current assets 4,935 3,656 3,341
Total assets 18,954 17,885 19,210
Total current liabilities 2,860 3,203 4,407
Total debt 4,361 3,118 2,647
Total stockholders’ equity 9,631 9,977 11,072
Number of employees (in thousands) 12 12 14
2003 Operating
Profit (Loss) Before
Depreciation and
Amortization
($M)
(1) Operating profit (loss) before depreciation and amortization, which is a financial measure that is not determined in accordance with
accounting principles generally accepted in the United States of America, or GAAP, can be calculated by adding amounts under the caption
“Depreciation and amortization” to “Operating Profit (loss).” This measure should be used in conjunction with GAAP financial measures and
is not presented as an alternative measure of operating results, as determined in accordance with GAAP. For a further discussion of operating
profit (loss) before depreciation and amortization, see Summary Data in Item 7. Management’s Discussion and Analysis of Financial Condition
and Results of Operations in The DIRECTV Group, Inc.’s Form 10-K for the year ended December 31, 2003 included in this Annual Report.
1