DIRECTV 2003 Annual Report Download - page 104
Download and view the complete annual report
Please find page 104 of the 2003 DIRECTV annual report below. You can navigate through the pages in the report by either clicking on the pages listed below, or by using the keyword search tool below to find specific information within the annual report.-
 1
1 -
2
-
3
-
4
-
5
-
6
-
7
-
8
-
9
-
10
-
11
-
12
-
13
-
14
-
15
-
16
-
17
-
18
-
19
-
20
-
21
-
22
-
23
-
24
-
25
-
26
-
27
-
28
-
29
-
30
-
31
-
32
-
33
-
34
-
35
-
36
-
37
-
38
-
39
-
40
-
41
-
42
-
43
-
44
-
45
-
46
-
47
-
48
-
49
-
50
-
51
-
52
-
53
-
54
-
55
-
56
-
57
-
58
-
59
-
60
-
61
-
62
-
63
-
64
-
65
-
66
-
67
-
68
-
69
-
70
-
71
-
72
-
73
-
74
-
75
-
76
-
77
-
78
-
79
-
80
-
81
-
82
-
83
-
84
-
85
-
86
-
87
-
88
-
89
-
90
-
91
-
92
-
93
-
 94
94 -
 95
95 -
 96
96 -
 97
97 -
 98
98 -
 99
99 -
 100
100 -
 101
101 -
 102
102 -
 103
103 -
 104
104 -
 105
105 -
 106
106 -
 107
107 -
 108
108 -
 109
109 -
 110
110 -
 111
111 -
 112
112 -
 113
113 -
 114
114 -
115
-
116
-
117
-
118
-
119
-
120
-
121
-
122
-
123
-
124
-
125
-
126
-
127
-
128
-
129
-
130
-
131
-
132
-
133
-
134
-
135
-
136
-
137
 |
 |

THE DIRECTV GROUP, INC.
NOTES TO THE CONSOLIDATED FINANCIAL STATEMENTS — (continued)
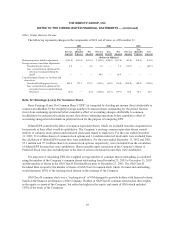
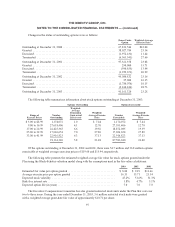
Changes in the status of outstanding options were as follows:
Shares Under
Option
Weighted-Average
Exercise Price
Outstanding at December 31, 2000 ..................................... 67,831,546 $23.04
Granted .......................................................... 38,027,784 23.34
Exercised ......................................................... (1,972,431) 11.44
Terminated ....................................................... (6,565,541) 27.66
Outstanding at December 31, 2001 ..................................... 97,321,358 23.08
Granted .......................................................... 290,000 15.71
Exercised ......................................................... (590,855) 13.44
Terminated ....................................................... (1,939,671) 20.99
Outstanding at December 31, 2002 ..................................... 95,080,832 23.16
Granted .......................................................... 25,000 16.35
Exercised ......................................................... (1,780,076) 10.15
Terminated ....................................................... (2,164,436) 28.73
Outstanding at December 31, 2003 ..................................... 91,161,320 23.28
The following table summarizes information about stock options outstanding at December 31, 2003:
Options Outstanding Options Exercisable
Range of
Exercise Prices
Number
Outstanding
Weighted-
Average
Remaining
Contractual
Life (years)
Weighted-
Average Exercise
Price
Number
Exercisable
Weighted-
Average Exercise
Price
$ 3.00 to $8.99 1,174,072 1.0 $ 7.44 1,174,072 $ 7.44
9.00 to 16.99 27,618,406 4.1 12.70 27,593,406 12.70
17.00 to 24.99 22,425,365 6.6 19.56 18,872,085 19.39
25.00 to 32.99 17,026,654 7.0 27.80 17,026,654 27.80
33.00 to 41.99 22,916,823 6.3 37.13 22,916,823 37.13
91,161,320 5.8 23.28 87,583,040 23.40
Of the options outstanding at December 31, 2002 and 2001, there were 54.7 million and 36.8 million options
exercisable at weighted average exercises prices of $19.60 and $15.94, respectively.
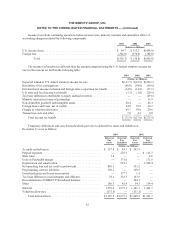
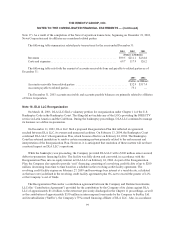
The following table presents the estimated weighted average fair value for stock options granted under the
Plan using the Black-Scholes valuation model along with the assumptions used in the fair value calculations:
2003 2002 2001
Estimated fair value per option granted ................................. $ 8.80 $ 9.19 $13.66
Average exercise price per option granted .............................. 16.35 15.71 23.34
Expected stock volatility ............................................ 47.2% 51.6% 51.3%
Risk-free interest rate ............................................... 3.8% 4.7% 5.1%
Expected option life (in years) ........................................ 7.0 7.0 7.0
The Executive Compensation Committee has also granted restricted stock units under the Plan that vest over
two to three years. During the year ended December 31, 2003, 3.6 million restricted stock units were granted
with a weighted average grant-date fair value of approximately $10.71 per share.
97