DIRECTV 2003 Annual Report Download - page 51
Download and view the complete annual report
Please find page 51 of the 2003 DIRECTV annual report below. You can navigate through the pages in the report by either clicking on the pages listed below, or by using the keyword search tool below to find specific information within the annual report.-
 1
1 -
2
-
3
-
4
-
5
-
6
-
7
-
8
-
9
-
10
-
11
-
12
-
13
-
14
-
15
-
16
-
17
-
18
-
19
-
20
-
21
-
22
-
23
-
24
-
25
-
26
-
27
-
28
-
29
-
30
-
31
-
32
-
33
-
34
-
35
-
36
-
37
-
38
-
39
-
40
-
 41
41 -
 42
42 -
 43
43 -
 44
44 -
 45
45 -
 46
46 -
 47
47 -
 48
48 -
 49
49 -
 50
50 -
 51
51 -
 52
52 -
 53
53 -
 54
54 -
 55
55 -
 56
56 -
 57
57 -
 58
58 -
 59
59 -
 60
60 -
 61
61 -
62
-
63
-
64
-
65
-
66
-
67
-
68
-
69
-
70
-
71
-
72
-
73
-
74
-
75
-
76
-
77
-
78
-
79
-
80
-
81
-
82
-
83
-
84
-
85
-
86
-
87
-
88
-
89
-
90
-
91
-
92
-
93
-
94
-
95
-
96
-
97
-
98
-
99
-
100
-
101
-
102
-
103
-
104
-
105
-
106
-
107
-
108
-
109
-
110
-
111
-
112
-
113
-
114
-
115
-
116
-
117
-
118
-
119
-
120
-
121
-
122
-
123
-
124
-
125
-
126
-
127
-
128
-
129
-
130
-
131
-
132
-
133
-
134
-
135
-
136
-
137
 |
 |

THE DIRECTV GROUP, INC.
Network Systems Segment
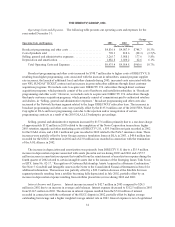
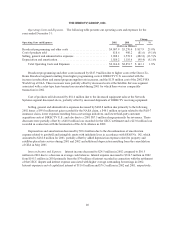
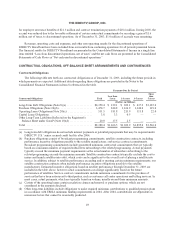
The following table provides operating results for the Network Systems segment for the years ended
December 31:
Change
2002 2001 $ %
(Dollars in Millions)
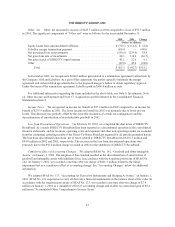
Revenues........................................... $1,169.9 $1,325.8 $(155.9) (11.8)%
Operating Loss Before Depreciation & Amortization ........ (76.8) (89.0) 12.2 13.7%
Operating Loss ...................................... (150.5) (149.0) (1.5) (1.0)%
The lower revenues resulted primarily from the substantial completion in late 2001 of two significant
customer contracts for the sale of phones and systems for mobile satellite programs, partially offset by increased
sales of DIRECTV set-top receivers, which totaled about 2.6 million units in 2002 compared to about 2.0 million
units in 2001.
The change in operating loss before depreciation and amortization resulted from a $24.5 million gain from
the recovery of receivables written-off in 1999 and lower general and administrative costs, partially offset by a
provision for inventory and severance costs totaling $15.0 million in 2002.
Eliminations and Other
The elimination of revenues increased to $240.6 million in 2002 from $238.3 million in 2001.
Operating loss from Eliminations and Other improved to $44.9 million in 2002 from an operating loss of
$84.2 million in 2001. The decrease in operating loss resulted primarily from the $95.0 million net gain recorded
in 2002 for the NASA claim and a 2001 severance charge of $23.0 million, partially offset by the $23.0 million
loss recorded in connection with the termination of the AOL alliance in 2002, higher corporate expenditures
related to costs associated with the terminated EchoStar merger and employee benefit costs in 2002.
LIQUIDITY AND CAPITAL RESOURCES
In 2003, our cash and cash equivalents balance increased $1,134.7 million to $2,263.3 million. This increase
resulted primarily from cash provided by operating activities of $1,275.4 million and additional net borrowings
of $1,243.2 million, partially offset by expenditures for satellites and property of $857.8 million, the special cash
dividend of $275.0 million paid to GM in connection with the split-off and $360 million paid to Boeing as a
result of our settlement of a purchase price dispute. Of the $2,263.3 million cash and cash equivalents balance at
December 31, 2003, $390.9 million is generally available only to DIRECTV U.S. and $511.2 million is generally
available only to PanAmSat because of restrictions within their respective borrowing agreements.
As a measure of liquidity, the current ratio (ratio of current assets to current liabilities) at December 31,
2003 and 2002 was 1.73 and 1.14, respectively. Working capital increased by $1,621.2 million to $2,074.5
million at December 31, 2003 from working capital of $453.3 million at December 31, 2002. The change was
principally due to the repayment of current debt obligations and an increase in cash balances which resulted from
cash flows from operating activities and the proceeds received from long-term borrowings under DIRECTV U.S.
financing transactions described in more detail below under “Notes Payable and Credit Facilities.”
As of December 31, 2003, DIRECTV U.S and PanAmSat each has the ability to borrow up to $250 million
under existing credit facilities. The DIRECTV U.S credit facility is available until 2008 and the PanAmSat credit
facility is available until 2007.
44