DIRECTV 2003 Annual Report Download - page 111
Download and view the complete annual report
Please find page 111 of the 2003 DIRECTV annual report below. You can navigate through the pages in the report by either clicking on the pages listed below, or by using the keyword search tool below to find specific information within the annual report.
THE DIRECTV GROUP, INC.
NOTES TO THE CONSOLIDATED FINANCIAL STATEMENTS — (continued)
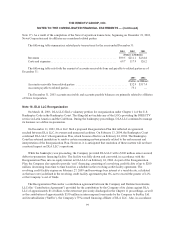
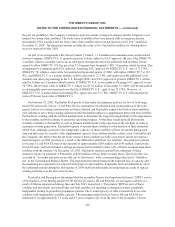
Selected information for the Company’s operating segments is reported as follows:
Direct-To-Home
Broadcast
Satellite
Services
Network
Systems Other Eliminations Total
(Dollars in Millions)
2003
External Revenues ............... $8,251.7 $ 702.1 $1,152.1 $ 15.3 — $10,121.2
Intersegment Revenues ........... 40.2 128.9 169.9 1.0 $(340.0) —
TotalRevenues ................. $8,291.9 $ 831.0 $1,322.0 $ 16.3 $(340.0) $10,121.2
Operating Profit (Loss) ........... $ 187.8 $ 278.2 $ (73.7) $ (235.0) $ (11.5) $ 145.8
Add: Depreciation and
Amortization ................. 696.3 312.8 76.2 (0.3) (2.2) 1,082.8
Operating Profit (Loss) Before
Depreciation and
Amortization(1) ............... $ 884.1 $ 591.0 $ 2.5 $ (235.3) $ (13.7) $ 1,228.6
Segment Assets ................. $7,941.9 $5,734.9 $2,555.3 $2,794.1 $ (72.0) $18,954.2
Capital Expenditures ............. 446.9 104.1 165.9 2.5 138.4 857.8
2002
External Revenues ............... $7,097.6 $ 647.3 $1,065.7 $ 51.9 — $ 8,862.5
Intersegment Revenues ........... 23.3 165.0 104.2 0.4 $(292.9) —
TotalRevenues ................. $7,120.9 $ 812.3 $1,169.9 $ 52.3 $(292.9) $ 8,862.5
Operating Profit (Loss) ........... $ (212.8) $ 255.9 $ (150.5) $ (52.5) $ 7.6 $ (152.3)
Add: Depreciation and
Amortization ................. 619.1 335.7 73.7 3.5 (11.8) 1,020.2
Operating Profit (Loss) Before
Depreciation and
Amortization(1) ............... $ 406.3 $ 591.6 $ (76.8) $ (49.0) $ (4.2) $ 867.9
Segment Assets ................. $7,957.2 $6,487.7 $2,526.9 $ 974.8 $ (61.5) $17,885.1
Capital Expenditures ............. 470.0 294.3 400.4 0.1 79.2 1,244.0
2001
External Revenues ............... $6,258.6 $ 709.0 $1,229.6 $ 40.0 — $ 8,237.2
Intersegment Revenues ........... 21.0 161.1 96.2 0.3 $(278.6) —
TotalRevenues ................. $6,279.6 $ 870.1 $1,325.8 $ 40.3 $(278.6) $ 8,237.2
Operating Profit (Loss) ........... $ (546.6) $ 165.3 $ (149.0) $ (117.3) $ 33.1 $ (614.5)
Add: Depreciation and
Amortization ................. 638.0 414.7 60.0 23.0 (25.1) 1,110.6
Operating Profit (Loss) Before
Depreciation and
Amortization(1) ............... $ 91.4 $ 580.0 $ (89.0) $ (94.3) $ 8.0 $ 496.1
Segment Assets ................. $9,484.1 $6,296.8 $2,339.1 $1,199.0 $(108.9) $19,210.1
Capital Expenditures ............. 693.6 338.2 664.6 0.4 6.0 1,702.8
(1) Operating Profit (Loss) Before Depreciation and Amortization, which is a financial measure that is not
determined in accordance with accounting principles generally accepted in the United States of America
104


