Clearwire 2008 Annual Report Download - page 81
Download and view the complete annual report
Please find page 81 of the 2008 Clearwire annual report below. You can navigate through the pages in the report by either clicking on the pages listed below, or by using the keyword search tool below to find specific information within the annual report.-
 1
1 -
2
-
3
-
4
-
5
-
6
-
7
-
8
-
9
-
10
-
11
-
12
-
13
-
14
-
15
-
16
-
17
-
18
-
19
-
20
-
21
-
22
-
23
-
24
-
25
-
26
-
27
-
28
-
29
-
30
-
31
-
32
-
33
-
34
-
35
-
36
-
37
-
38
-
39
-
40
-
41
-
42
-
43
-
44
-
45
-
46
-
47
-
48
-
49
-
50
-
51
-
52
-
53
-
54
-
55
-
56
-
57
-
58
-
59
-
60
-
61
-
62
-
63
-
64
-
65
-
66
-
67
-
68
-
69
-
70
-
 71
71 -
 72
72 -
 73
73 -
 74
74 -
 75
75 -
 76
76 -
 77
77 -
 78
78 -
 79
79 -
 80
80 -
 81
81 -
 82
82 -
 83
83 -
 84
84 -
 85
85 -
 86
86 -
 87
87 -
 88
88 -
 89
89 -
 90
90 -
 91
91 -
92
-
93
-
94
-
95
-
96
-
97
-
98
-
99
-
100
-
101
-
102
-
103
-
104
-
105
-
106
-
107
-
108
-
109
-
110
-
111
-
112
-
113
-
114
-
115
-
116
-
117
-
118
-
119
-
120
-
121
-
122
-
123
-
124
-
125
-
126
-
127
-
128
-
129
-
130
-
131
-
132
-
133
-
134
-
135
-
136
-
137
-
138
-
139
-
140
-
141
-
142
-
143
-
144
-
145
-
146
-
147
-
148
-
149
-
150
-
151
-
152
 |
 |

a
bili
ty to o
b
ta
i
na
ddi
t
i
ona
l
externa
lfi
nanc
i
ng. T
h
ee
ff
ects o
f
t
h
ese c
h
anges cou
ld
a
l
so requ
i
re us to ma
k
e mater
i
a
l
c
han
g
es to our current plans and strate
gy
.
C
as
h
F
l
ow Ana
ly
si
s
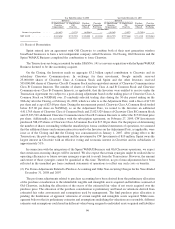
T
he followin
g
anal
y
sis includes the results of operations for the Sprint WiMAX Business for the first eleve
n
m
onths of 2008 prior to the closing of the Transactions and the results of operations for Clearwire subsequent to th
e
cl
os
i
ng o
f
t
h
e Transact
i
ons on Novem
b
er 28, 2008. T
h
e 2007 operat
i
ons
d
ata represents t
h
e Spr
i
nt W
i
MA
X
Business’ historical results of o
p
erations.
T
he statement of cash flows includes the activities that were paid by Sprint on behalf of us prior to the closin
g
o
f
t
h
e Transact
i
ons. F
i
nanc
i
n
g
act
i
v
i
t
i
es
i
nc
l
u
d
e
f
un
di
n
g
a
d
vances
f
rom Spr
i
nt t
h
rou
gh
Novem
b
er 28, 2008.
Furt
h
er, t
h
e net cas
h
use
di
n operat
i
n
g
act
i
v
i
t
i
es an
d
t
h
e net cas
h
use
di
n
i
nvest
i
n
g
act
i
v
i
t
i
es
f
or cap
i
ta
l
expen
di
ture
s
and acquisitions of spectrum licenses and patents represent transfers of expenses or assets paid for by other Sprin
t
s
u
b
s
idi
ar
i
es
.
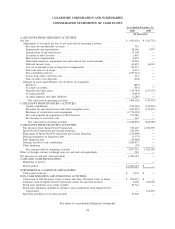
T
he followin
g
table presents a summar
y
of our cash flows and be
g
innin
g
and endin
g
cash balances for th
e
y
ears ended December 31, 2008 and 2007 (in thousands)
:
2
008
2
00
7
Y
ear Ended December 31
,
C
as
h
use
di
n operat
i
ng act
i
v
i
t
i
es
.
.............................
$
(
406,306
)$(
339,519
)
C
as
h
use
di
n
i
nvest
i
ng act
i
v
i
t
i
e
s
.
.............................
(
2,245,830
)(
683,080
)
C
as
h
prov
id
e
db
y
fi
nanc
i
ng act
i
v
i
t
i
es
.
......................... 3
,
8
5
7
,
7
55
1
,
022
,5
9
9
Effect of foreign currency exchange rates on cash and cash
equivalents ............................................
5
24
—
T
ota
l
cas
hfl
o
w
s
..........................................
1
,20
6
,143 —
C
as
h
an
d
cas
h
equ
i
va
l
ents at
b
eg
i
nn
i
ng o
f
per
i
o
d
.
................
——
C
as
h
an
d
cas
h
equ
i
va
l
ents at en
d
o
f
per
i
o
d
.
.....................
$
1,
206
,
143
$
—
O
p
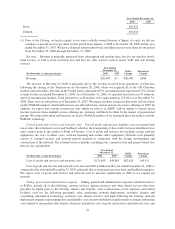
erating Activities
Net cash used in operatin
g
activities was $406.3 million for the
y
ear ended December 31, 2008. The cash use
d
i
n operations is due primaril
y
to pa
y
ments for operatin
g
expenses, as we continue to expand and operate ou
r
business, and interest payments to service debt. This is partially offset by
$
20.2 million in cash received from
c
us
t
omers
.
Net cash used in operating activities was
$
339.5 million for the year ended December 31, 2007.
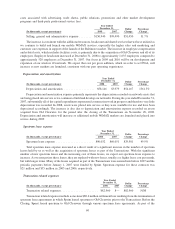
I
nvest
i
n
g
Act
i
v
i
t
i
es
D
uring the year ended December 31, 2008, net cash used in investing activities was
$
2.2 billion. The net cash
used in investing activities is due primarily to
$
1.8 billion in purchases of available-for-sale securities following the
$
3.2 billion cash investment from the Investors,
$
534.2 million in cash paid for propert
y
, plant and equipment and
$109.3 million in pa
y
ments for acquisition of spectrum licenses and other intan
g
ibles. These uses of cash are
p
artially offset by
$
171.8 million of cash acquired from Old Clearwire as a result of the Transactions
.
D
urin
g
the
y
ear ended December 31, 2007, net cash used in investin
g
activities was
$
683.1 million. The ne
t
c
ash used in investin
g
activities is due to $353.6 million in pa
y
ments for acquisition of spectrum licenses and other
i
ntangibles and
$
329.5 million in cash paid for property, plant and equipment.
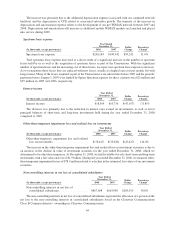
F
inancing Activities
Net cash provided by financing activities was
$
3.9 billion for the year ended December 31, 2008. This i
s
p
rimarily due to
$
3.2 billion of cash received from the Investors,
$
532.2 million pre-transaction funding from Sprin
t
and $392.2 million from the Sprint Pre-Closin
g
Financin
g
Amount, up throu
g
h the Closin
g
. These are partiall
y
69