Clearwire 2008 Annual Report Download - page 71
Download and view the complete annual report
Please find page 71 of the 2008 Clearwire annual report below. You can navigate through the pages in the report by either clicking on the pages listed below, or by using the keyword search tool below to find specific information within the annual report.-
 1
1 -
2
-
3
-
4
-
5
-
6
-
7
-
8
-
9
-
10
-
11
-
12
-
13
-
14
-
15
-
16
-
17
-
18
-
19
-
20
-
21
-
22
-
23
-
24
-
25
-
26
-
27
-
28
-
29
-
30
-
31
-
32
-
33
-
34
-
35
-
36
-
37
-
38
-
39
-
40
-
41
-
42
-
43
-
44
-
45
-
46
-
47
-
48
-
49
-
50
-
51
-
52
-
53
-
54
-
55
-
56
-
57
-
58
-
59
-
60
-
 61
61 -
 62
62 -
 63
63 -
 64
64 -
 65
65 -
 66
66 -
 67
67 -
 68
68 -
 69
69 -
 70
70 -
 71
71 -
 72
72 -
 73
73 -
 74
74 -
 75
75 -
 76
76 -
 77
77 -
 78
78 -
 79
79 -
 80
80 -
 81
81 -
82
-
83
-
84
-
85
-
86
-
87
-
88
-
89
-
90
-
91
-
92
-
93
-
94
-
95
-
96
-
97
-
98
-
99
-
100
-
101
-
102
-
103
-
104
-
105
-
106
-
107
-
108
-
109
-
110
-
111
-
112
-
113
-
114
-
115
-
116
-
117
-
118
-
119
-
120
-
121
-
122
-
123
-
124
-
125
-
126
-
127
-
128
-
129
-
130
-
131
-
132
-
133
-
134
-
135
-
136
-
137
-
138
-
139
-
140
-
141
-
142
-
143
-
144
-
145
-
146
-
147
-
148
-
149
-
150
-
151
-
152
 |
 |

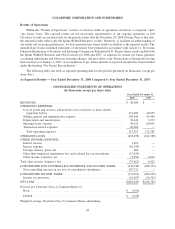
2008 2007
Y
ear Ended December
31,
B
as
i
c
..........................................................
189
,
921
D
il
uted
........................................................
6
94,921
(1) Prior to the Closin
g
, we had no equit
y
as we were a wholl
y
-owned division of Sprint. As such, we did no
t
c
alculate or present net loss per share for the period from Januar
y
1, 2008 to November 28, 2008 and the
y
ear
e
n
d
e
d
Decem
b
er 31, 2007. We
h
ave ca
l
cu
l
ate
d
an
d
presente
db
as
i
can
d dil
ute
d
net
l
oss per s
h
are
f
or t
h
e per
i
o
d
f
rom Novem
b
er 29, 2008 t
h
rou
gh
Decem
b
er 31, 2008
.
Revenue. Revenue
i
spr
i
mar
ily g
enerate
df
rom su
b
scr
i
pt
i
on an
d
mo
d
em
l
ease
f
ees
f
or our w
i
re
l
ess
b
roa
d-
b
an
d
serv
i
ce, as we
ll
as
f
rom act
i
vat
i
on
f
ees an
df
ees
f
or ot
h
er serv
i
ces suc
h
as ema
il
, VoIP, an
d
we
bh
ost
i
n
g
s
ervices
.
(
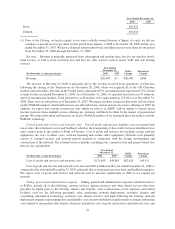
In thousands, except percentages
)
2008 200
7
D
o
ll
a
r
C
hang
e
P
ercentag
e
Change
Year Ende
d
December 31,
R
e
v
enue
.
.....................................
$
20
,
489
$
—
$
20
,
489 N/M
T
he increase in Revenue for 2008 is primarily due to the revenue received from operations of Clearwir
e
f
o
ll
ow
i
ng t
h
ec
l
os
i
ng o
f
t
h
e Transact
i
ons on Novem
b
er 28, 2008, w
h
ere we acqu
i
re
d
a
ll
o
f
t
h
eO
ld
C
l
earw
i
r
e
m
ar
k
ets an
d
su
b
scr
ib
ers. Revenue
i
nt
h
eUn
i
te
d
States re
p
resente
d
87% an
di
nternat
i
ona
l
re
p
resente
d
13% o
f
tota
l
r
evenue for the year ended December 31, 2008. As of December 31, 2008, we operated our services in 47 domestic
and four international markets. Total subscribers in all markets were approximately 47
5
,000 as of December 31,
2008. T
h
ere were no su
b
scr
ib
ers as o
f
Decem
b
er 31, 2007. We expect revenues to
i
ncrease
d
ue to t
h
ero
ll
out o
f
new
m
obile WiMAX markets, which will increase our subscriber base, and an increase in service offerin
g
s in 2009. I
n
addition, we expect that average revenue per user, which we refer to as ARPU, will be similar to current level
s
b
ecause
i
ncreases
f
rom mu
l
t
i
p
l
e serv
i
ce o
ff
er
i
n
g
s per customer w
ill lik
e
ly b
eo
ff
set
by
t
h
e
i
mpact o
f
promot
i
ona
l
p
ricin
g
. We expect that churn will increase in our pre-WiMAX markets as we transition these networks to mobil
e
W
iMAX technolo
gy
.
C
ost o
f
goods and services and network costs
.
Cost of
g
oods and services includes costs associated wit
h
tower rents,
di
rect Internet access an
db
ac
kh
au
l
,w
hi
c
hi
st
h
e transport
i
ng o
fd
ata tra
ffi
c
b
etween
di
str
ib
ute
d
s
i
tes
an
d
a centra
l
po
i
nt
i
nt
h
e mar
k
et or Po
i
nt o
f
Presence. Cost o
fg
oo
d
san
d
serv
i
ces a
l
so
i
nc
l
u
d
es certa
i
n networ
k
e
quipment, site costs, facilities costs, software licensin
g
and certain office equipment. Network costs primaril
y
c
onsist of external services and internal payroll incurred in connection with the design, development an
d
c
onstruct
i
on o
f
t
h
e networ
k
.T
h
e externa
l
serv
i
ces
i
nc
l
u
d
e consu
l
t
i
n
gf
ees, contractor
f
ees an
d
pro
j
ect-
b
ase
df
ees
t
h
at are not ca
pi
ta
li
za
bl
e.
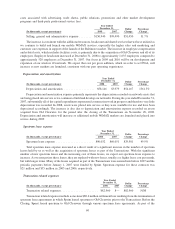
(
In thousands, except percentages
)
2008 200
7
Dollar
C
hang
e
P
ercentag
e
C
hange
Yea
r
E
n
ded
December 31
,
C
ost of goods and services and network costs . . . . . .
$
131,489
$
48,865
$
82,624 169.1
%
C
ost of goods and services and network costs increased
$
82.6 million in the year ended December 31, 2008 a
s
c
ompare
d
to t
h
e
y
ear en
d
e
d
Decem
b
er 31, 2007, pr
i
mar
ily d
ue to an
i
ncrease
i
n tower
l
ease an
db
ac
kh
au
l
expenses.
W
e expect costs o
fg
oo
d
san
d
serv
i
ces an
d
networ
k
costs to
i
ncrease s
ig
n
ifi
cant
ly i
n 2009 as we expan
d
ou
r
n
etwork.
S
ellin
g
,
g
eneral and administrative expense
.
Sellin
g
,
g
eneral and administrative expenses, which we refer t
o
as SG&A,
i
nc
l
u
d
ea
ll
o
f
t
h
e
f
o
ll
ow
i
ng: treasury serv
i
ces,
h
uman resources an
d
ot
h
er s
h
are
d
serv
i
ces t
h
at wer
e
p
rov
id
e
dby
Spr
i
nt pr
i
or to t
h
eC
l
os
i
n
g
;sa
l
ar
i
es an
db
ene
fi
ts, sa
l
es comm
i
ss
i
ons, trave
l
expenses an
d
re
l
ate
d
facilities costs for the followin
g
personnel: sales, marketin
g
, network deplo
y
ment, executive, finance an
d
account
i
ng,
i
n
f
ormat
i
on tec
h
no
l
ogy, customer care,
h
uman resource an
dl
ega
lf
o
ll
ow
i
ng t
h
eC
l
os
i
ng; networ
k
d
ep
l
oyment expenses represent
i
ng non-cap
i
ta
li
za
bl
e costs on networ
kb
u
ild
s
i
n mar
k
ets pr
i
or to
l
aunc
h
, rat
h
er t
h
an
c
osts related to our markets after launch, which are included in cost of
g
oods and services and network costs; an
d
59