Clearwire 2008 Annual Report Download - page 127
Download and view the complete annual report
Please find page 127 of the 2008 Clearwire annual report below. You can navigate through the pages in the report by either clicking on the pages listed below, or by using the keyword search tool below to find specific information within the annual report.-
 1
1 -
2
-
3
-
4
-
5
-
6
-
7
-
8
-
9
-
10
-
11
-
12
-
13
-
14
-
15
-
16
-
17
-
18
-
19
-
20
-
21
-
22
-
23
-
24
-
25
-
26
-
27
-
28
-
29
-
30
-
31
-
32
-
33
-
34
-
35
-
36
-
37
-
38
-
39
-
40
-
41
-
42
-
43
-
44
-
45
-
46
-
47
-
48
-
49
-
50
-
51
-
52
-
53
-
54
-
55
-
56
-
57
-
58
-
59
-
60
-
61
-
62
-
63
-
64
-
65
-
66
-
67
-
68
-
69
-
70
-
71
-
72
-
73
-
74
-
75
-
76
-
77
-
78
-
79
-
80
-
81
-
82
-
83
-
84
-
85
-
86
-
87
-
88
-
89
-
90
-
91
-
92
-
93
-
94
-
95
-
96
-
97
-
98
-
99
-
100
-
101
-
102
-
103
-
104
-
105
-
106
-
107
-
108
-
109
-
110
-
111
-
112
-
113
-
114
-
115
-
116
-
 117
117 -
 118
118 -
 119
119 -
 120
120 -
 121
121 -
 122
122 -
 123
123 -
 124
124 -
 125
125 -
 126
126 -
 127
127 -
 128
128 -
 129
129 -
 130
130 -
 131
131 -
 132
132 -
 133
133 -
 134
134 -
 135
135 -
 136
136 -
 137
137 -
138
-
139
-
140
-
141
-
142
-
143
-
144
-
145
-
146
-
147
-
148
-
149
-
150
-
151
-
152
 |
 |

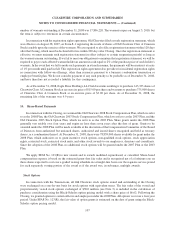
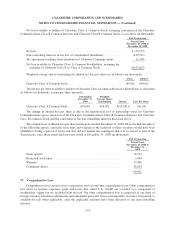
Th
e
f
o
ll
ow
i
ng ta
bl
e sets
f
ort
h
t
h
e components o
f
compre
h
ens
i
ve
l
oss (
i
nt
h
ousan
d
s):
2
008 2007
F
or
Th
e
Y
ear
E
n
d
e
d
D
ecember 31
,
Net
l
oss..................................................
$(
432,626
)$(
224,725
)
O
ther comprehensive loss
:
Net unrealized gain on available-for-sale investment
s
.
..............
5
12
—
Forei
g
n currenc
y
translation ad
j
ustment
.........................
2,682 —
T
ota
l
ot
h
er com
p
re
h
ens
i
ve
l
oss
.................................
3
,
194
—
T
ota
l
compre
h
ens
i
ve
l
oss . .
...................................
$(
429,432
)$(
224,725
)
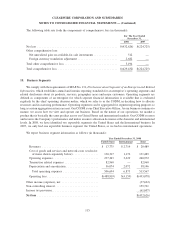
18. Business Se
g
ments
We comp
l
yw
i
t
h
t
h
e requ
i
rements o
f
SFAS No. 131, Disc
l
osures a
b
out Segments o
f
an Enterprise an
d
Re
l
ate
d
Information
,
whi
c
h
esta
bli
s
h
es annua
l
an
di
nter
i
m report
i
n
g
stan
d
ar
d
s
f
or an enterpr
i
se’s operat
i
n
g
se
g
ments an
d
r
elated disclosures about its products, services,
g
eo
g
raphic areas and ma
j
or customers. Operatin
g
se
g
ments are
defined as com
p
onents of an enter
p
rise for which se
p
arate financial information is available that is evaluate
d
r
e
g
u
l
ar
ly by
t
h
ec
hi
e
f
operat
i
n
gd
ec
i
s
i
on ma
k
er, w
hi
c
h
we re
f
er to as t
h
e CODM,
i
n
d
ec
idi
n
gh
ow to a
ll
ocate
r
esources an
di
n assess
i
n
g
per
f
ormance. Operat
i
n
g
se
g
ments can
b
ea
gg
re
g
ate
df
or se
g
ment report
i
n
g
purposes s
o
lon
g
as certain a
gg
re
g
ation criteria are met. Our CODM is our Chief Executive Officer. As our business continues to
m
ature, we assess
h
ow we v
i
ew an
d
operate our
b
us
i
ness. Base
d
on t
h
e nature o
f
our operat
i
ons, we mar
k
et
a
p
roduct that is basicall
y
the same product across our United States and international markets. Our CODM assesses
and reviews the Compan
y
’s performance and makes resource allocation decisions at the domestic and internationa
l
l
eve
l
s. In 2008, we
h
ave
id
ent
ifi
e
d
two reporta
bl
e segments: t
h
eUn
i
te
d
States an
d
t
h
e Internat
i
ona
lb
us
i
ness. In
2
007, we onl
y
had one reportable business se
g
ment: the United States, as we had no international operations
.
We report business se
g
ment information as follows (in thousands)
:
U
nited
S
tates International Total
Year Ended December
31
,
2008
R
evenues ...................................
$
17
,
775 $ 2
,
714 $ 20
,
48
9
C
ost of
g
oods and services and network costs (exclusive
o
f items shown separatel
y
below)
................
1
30,317 1,172 131,48
9
Operatin
g
expenses
............................
2
37,343 3,629 240,97
2
Transaction related ex
p
enses
.....................
8
2,9
6
0 — 82,9
6
0
De
p
rec
i
at
i
on an
d
amort
i
zat
i
on
....................
56,074 2,072 58,14
6
Tota
l
operat
i
ng expenses
......................
5
06
,
694 6
,
873 513
,
56
7
Operating loss ................................
$(
488,919
)$(
4,159
)$(
493,078
)
Ot
h
er
i
ncome (expense), net
.......................
(
37,
66
2
)
N
on-contro
lli
ng
i
nterest
.
.......................... 159
,
72
1
I
ncome tax provision.............................
(
61,607
)
N
et loss
......................................
$
(432,626
)
11
5
CLEARWIRE CORPORATION AND
S
UB
S
IDIARIE
S
N
OTES TO CONSOLIDATED FINANCIAL STATEMENTS —
(
Continued
)