Clearwire 2008 Annual Report Download - page 75
Download and view the complete annual report
Please find page 75 of the 2008 Clearwire annual report below. You can navigate through the pages in the report by either clicking on the pages listed below, or by using the keyword search tool below to find specific information within the annual report.-
 1
1 -
2
-
3
-
4
-
5
-
6
-
7
-
8
-
9
-
10
-
11
-
12
-
13
-
14
-
15
-
16
-
17
-
18
-
19
-
20
-
21
-
22
-
23
-
24
-
25
-
26
-
27
-
28
-
29
-
30
-
31
-
32
-
33
-
34
-
35
-
36
-
37
-
38
-
39
-
40
-
41
-
42
-
43
-
44
-
45
-
46
-
47
-
48
-
49
-
50
-
51
-
52
-
53
-
54
-
55
-
56
-
57
-
58
-
59
-
60
-
61
-
62
-
63
-
64
-
 65
65 -
 66
66 -
 67
67 -
 68
68 -
 69
69 -
 70
70 -
 71
71 -
 72
72 -
 73
73 -
 74
74 -
 75
75 -
 76
76 -
 77
77 -
 78
78 -
 79
79 -
 80
80 -
 81
81 -
 82
82 -
 83
83 -
 84
84 -
 85
85 -
86
-
87
-
88
-
89
-
90
-
91
-
92
-
93
-
94
-
95
-
96
-
97
-
98
-
99
-
100
-
101
-
102
-
103
-
104
-
105
-
106
-
107
-
108
-
109
-
110
-
111
-
112
-
113
-
114
-
115
-
116
-
117
-
118
-
119
-
120
-
121
-
122
-
123
-
124
-
125
-
126
-
127
-
128
-
129
-
130
-
131
-
132
-
133
-
134
-
135
-
136
-
137
-
138
-
139
-
140
-
141
-
142
-
143
-
144
-
145
-
146
-
147
-
148
-
149
-
150
-
151
-
152
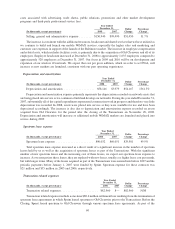
 |
 |

(
In thousands, except percenta
g
es) 2008 2007
D
olla
r
C
han
ge
Percenta
ge
Chan
g
e
Y
ea
rEn
ded
December
31,
R
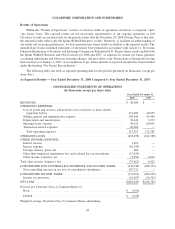
evenue
.................................
$230,646 $151,440 $79,206 52.3%
R
evenue in the United States represented 84% and international represented 16% of total revenue for the year
e
nded December 31, 2008 compared to 81% and 19% for the year ended December 31, 2007, respectively. Total
s
ubscribers in all markets
g
rew to approximatel
y
475,000 as of December 31, 2008 (actual) from approximatel
y
3
94,000 as of December 31, 2007 (pro forma). The
g
rowth in subscribers and the increase in services available t
o
c
ustomers were the primary reasons for the increase in revenue when comparing the year ended December 31, 2008
t
ot
h
e year en
d
e
d
Decem
b
er 31, 2007. We expect revenues to
i
ncrease
d
ue to t
h
ero
ll
out o
f
new mo
bil
eW
i
MAX
m
arkets, which will increase our subscriber base, and an increase in service offerin
g
s in 2009. In addition, we expec
t
t
hat ARPU will be similar to current levels because increases from multiple service offerin
g
s per customer, wil
l
lik
e
l
y
b
eo
ff
set
b
yt
h
e
i
mpact o
f
promot
i
ona
l
pr
i
c
i
ng. We expect t
h
at c
h
urn w
ill i
ncrease
i
n our pre-W
i
MAX mar
k
ets
as we transition these networks to mobile WiMAX technolo
gy
.
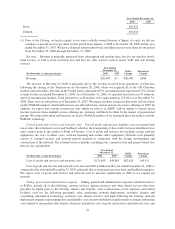
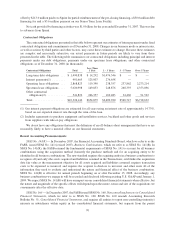
Cost of goo
d
san
d
services an
d
networ
k
costs. Costs o
fg
oo
d
san
d
serv
i
ces an
d
networ
k
costs pr
i
mar
ily
i
ncludes costs associated with tower rents, direct Internet access and backhaul, as well as network related ex
p
enses
.
Cost o
fg
oo
d
san
d
serv
i
ces an
d
networ
k
costs a
l
so
i
nc
l
u
d
es certa
i
n networ
k
equ
i
pment, s
i
te costs,
f
ac
ili
t
i
es costs,
s
o
f
tware
li
cens
i
n
g
an
d
certa
i
no
ffi
ce equ
i
pment
.
(
In thousands, except percentages
)
2008 200
7
D
olla
r
Change
Percenta
ge
Change
Year Ended
D
ecember
31,
C
ost of
g
oods and services and network costs
....
$
285,759 $156,146 $129,613 83.0%
Th
e
i
ncrease
i
n cost o
f
goo
d
san
d
serv
i
ces an
d
networ
k
costs was pr
i
mar
il
y
d
ue to an
i
ncrease
i
nt
h
e num
b
er o
f
t
owers,
i
ncreases
i
n
di
rect Internet access an
d
re
l
ate
db
ac
kh
au
l
costs an
d
a
ddi
t
i
ona
l
expenses as we
l
aunc
h
e
d
an
additional market in 2008 and
p
re
p
ared for future mobile WiMAX builds from December 31, 2007 to December 31
,
2
008. We expect costs of goods and services and network costs to increase significantly in 2009 as we expand our
n
et
w
or
k
.
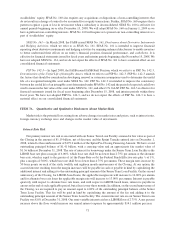
S
e
ll
ing, genera
l
an
d
a
d
ministrative expense. SG&A
i
nc
l
u
d
es a
ll
o
f
t
h
e
f
o
ll
ow
i
ng: treasury serv
i
ces,
h
uma
n
r
esources and other shared services that were provided b
y
Sprint prior to the Closin
g
; salaries and benefits, sales
c
ommissions, travel expenses and related facilities costs for the followin
g
personnel: sales, marketin
g
, network
d
ep
l
oyment, execut
i
ve,
fi
nance an
d
account
i
ng,
i
n
f
ormat
i
on tec
h
no
l
ogy, customer care,
h
uman resource; networ
k
deplo
y
ment expenses representin
g
non-capitalizable costs on network builds in markets prior to launch, rather than
c
osts related to our markets after launch which is included in cost of
g
oods and services and network costs; and cost
s
assoc
i
ate
d
w
i
t
h
a
d
vert
i
s
i
ng, tra
d
es
h
ows, pu
bli
cre
l
at
i
ons, promot
i
ons an
d
ot
h
er mar
k
et
d
eve
l
opment programs an
d
t
hi
r
d
-part
y
pro
f
ess
i
ona
l
serv
i
ce
f
ees.
(
In thousands, except percentages
)
2008 2007
D
olla
r
C
hang
e
Percenta
ge
Change
Year Ende
d
December
31,
Selling, general and administrative expense
.
.....
.
$484
,
421 $461
,
553 $22
,
868 5.0
%
T
he increase in SG&A was due to additional costs related to the launch of mobile WiMAX services, which was
o
ff
set
b
yre
d
uct
i
ons
i
n emp
l
oyee
h
ea
d
count an
d
re
l
ate
d
expenses. Our emp
l
oyee
h
ea
d
count was approx
i
mate
ly
1
,635 at December 31, 2008 (actual) compared to approximately 2,510 employees at December 31, 2007 (pr
o
forma). Our focus in 2009 and 2010 will be on develo
p
ment and ex
p
ansion of our wireless 4G network. We ex
p
ec
t
th
at CPGA w
ill i
ncrease as new mar
k
ets are
l
aunc
h
e
d
, cons
i
stent w
i
t
h
our past operat
i
ng exper
i
ences.
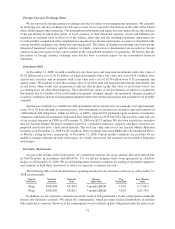
De
p
reciation an
d
amortizatio
n
(
In thousands, except percentages
)
2008 200
7
D
o
ll
a
r
C
hang
e
P
ercentag
e
Change
Y
ear Ended
December
31,
D
epreciation and amortizatio
n
.
................
.
$
128
,
602
$
80
,
766
$
47
,
836 59.2%
6
3