Clearwire 2008 Annual Report Download - page 72
Download and view the complete annual report
Please find page 72 of the 2008 Clearwire annual report below. You can navigate through the pages in the report by either clicking on the pages listed below, or by using the keyword search tool below to find specific information within the annual report.
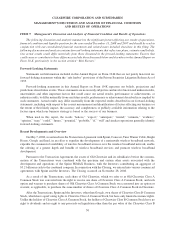
c
osts assoc
i
ate
d
w
i
t
h
a
d
vert
i
s
i
ng, tra
d
es
h
ows, pu
bli
cre
l
at
i
ons, promot
i
ons an
d
ot
h
er mar
k
et
d
eve
l
opment
p
ro
g
rams and third-part
y
professional service fees
.
(
In thousands, except percentages
)
2008 200
7
D
o
ll
a
r
C
hang
e
P
ercentag
e
C
hange
Y
ear
E
n
d
e
d
December 31
,
Se
lli
ng, genera
l
an
d
a
d
m
i
n
i
strat
i
ve expense ........
$
150
,
940
$
99
,
490
$
51
,
450 51.7%
T
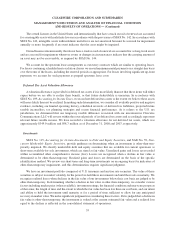
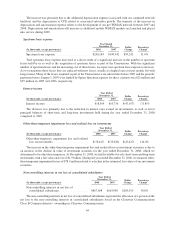
he increase is consistent with the additional resources, headcount and shared services that we have utilized a
s
we continue to build and launch our mobile WiMAX services, especially the higher sales and marketing and
c
ustomer care expenses
i
n support o
f
t
h
e
l
aunc
h
o
f
t
h
eBa
l
t
i
more mar
k
et. T
h
e
i
ncrease
i
n emp
l
oyee compensat
i
o
n
an
d
re
l
ate
d
costs, w
hi
c
hi
nc
l
u
d
es
f
ac
ili
t
i
es costs,
i
spr
i
mar
ily d
ue to t
h
e acqu
i
s
i
t
i
on o
f
O
ld
C
l
earw
i
re an
d
a
ll
o
fi
ts
e
mployees. Employee headcount increased at December 31, 2008 to approximately 1,63
5
employees compared to
approximately 520 employees at December 31, 2007. Our focus in 2009 and 2010 will be on development an
d
e
xpans
i
on o
f
our w
i
re
l
ess 4G networ
k
. We expect t
h
at cost per
g
ross a
ddi
t
i
on, w
hi
c
h
we re
f
er to as CPGA, w
ill
i
ncrease as new markets are launched, consistent with our past operatin
g
experiences
.
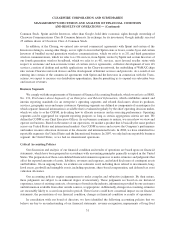
D
epreciation and amortizatio
n
(
In thousands, except percenta
g
es
)
2008 200
7
Dollar
C
han
ge
P
ercentag
e
C
han
g
e
Y
ear Ended
December 31,
D
eprec
i
at
i
on an
d
amort
i
zat
i
o
n
...................
$
58
,
146
$
3
,
979
$
54
,
167 1361.3
%
D
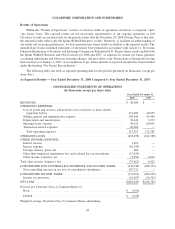
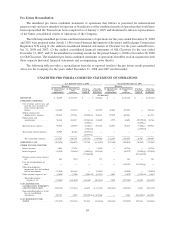
epreciation and amortization expense primaril
y
represents the depreciation recorded on network assets tha
t
are
b
e
i
ng p
l
ace
di
nto serv
i
ce as we cont
i
nue to
b
u
ild
an
dd
eve
l
op our networ
k
s. Dur
i
ng t
h
e year en
d
e
d
Decem
b
er 31
,
2
007, su
b
stant
i
a
ll
ya
ll
o
f
t
h
e cap
i
ta
l
expen
di
tures represente
d
construct
i
on wor
ki
n progress an
d
t
h
ere
f
ore very
li
tt
le
depreciation was recorded. In 2008, assets were placed into service as the
y
were available for use and have bee
n
depreciated accordingly. The increase is also due to depreciation and amortization expense recorded on assets
acqu
i
re
df
rom O
ld
C
l
earw
i
re
f
or t
h
e per
i
o
d
a
f
ter t
h
ec
l
os
i
ng o
f
t
h
e Transact
i
ons on Novem
b
er 28, 2008.
D
e
p
rec
i
at
i
on an
d
amort
i
zat
i
on w
ill i
ncrease as a
ddi
t
i
ona
l
mo
bil
eW
i
MAX mar
k
ets are
l
aunc
h
e
d
an
dpl
ace
di
nto
s
ervice during 2009
.
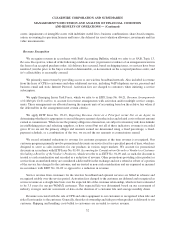
Spectrum lease expens
e
(
In thousands, except percentages
)
2008 200
7
D
o
ll
a
r
C
hang
e
P
ercentag
e
Change
Y
ear Ended
D
ecember
31,
Spectrum
l
ease expens
e
......................
.
$
90
,
032
$
60
,
051
$
29
,
981 49.9%
T
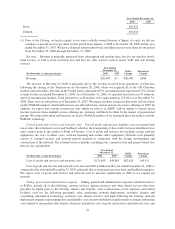
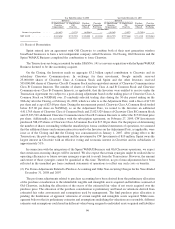
otal spectrum lease expense increased as a direct result of a si
g
nificant increase in the number of spectru
m
leases held b
y
us as well as the acquisition of spectrum leases as part of the Transactions. With the si
g
nifican
t
n
um
b
er o
f
new spectrum
l
eases an
d
t
h
e
i
ncreas
i
ng cost o
f
t
h
ese
l
eases, we expect our spectrum
l
ease expense t
o
i
ncrease. As we rene
g
otiate these leases, the
y
are replaced with new leases, usuall
y
at a hi
g
her lease cost per month
,
b
ut with lon
g
er terms. Man
y
of the leases acquired as part of the Transactions were entered into before 2007 and th
e
p
er
i
o
di
c payments
b
e
f
ore January 1, 2007 were
f
un
d
e
db
y Spr
i
nt. Spectrum expense
f
or t
h
ese contracts was
$21 million and $35 million in 2005 and 2006, respectivel
y
.
T
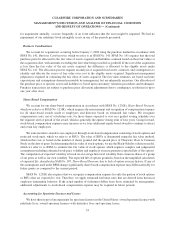
ransaction re
l
ate
d
ex
p
enses
(
In thousands, except percentages
)
2008 200
7
D
olla
r
C
hang
e
Percenta
ge
Change
Year Ende
d
December
31,
T
ransaction related ex
p
ense
s
.......................
$
82,960 $— $82,960 N/M
T
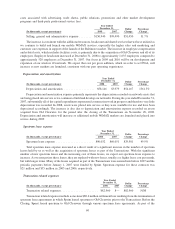
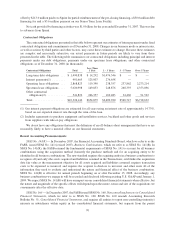
ransaction related expenses include a one-time
$
80.6 million settlement loss resultin
g
from the termination of
s
pectrum
l
ease a
g
reements
i
nw
hi
c
h
Spr
i
nt
l
ease
d
spectrum to O
ld
C
l
earw
i
re pr
i
or to t
h
e Transact
i
ons. Be
f
ore t
he
Closing, Sprint leased spectrum to Old Clearwire through various spectrum lease agreements. As part of the
60


