Clearwire 2008 Annual Report Download - page 76
Download and view the complete annual report
Please find page 76 of the 2008 Clearwire annual report below. You can navigate through the pages in the report by either clicking on the pages listed below, or by using the keyword search tool below to find specific information within the annual report.-
 1
1 -
2
-
3
-
4
-
5
-
6
-
7
-
8
-
9
-
10
-
11
-
12
-
13
-
14
-
15
-
16
-
17
-
18
-
19
-
20
-
21
-
22
-
23
-
24
-
25
-
26
-
27
-
28
-
29
-
30
-
31
-
32
-
33
-
34
-
35
-
36
-
37
-
38
-
39
-
40
-
41
-
42
-
43
-
44
-
45
-
46
-
47
-
48
-
49
-
50
-
51
-
52
-
53
-
54
-
55
-
56
-
57
-
58
-
59
-
60
-
61
-
62
-
63
-
64
-
65
-
 66
66 -
 67
67 -
 68
68 -
 69
69 -
 70
70 -
 71
71 -
 72
72 -
 73
73 -
 74
74 -
 75
75 -
 76
76 -
 77
77 -
 78
78 -
 79
79 -
 80
80 -
 81
81 -
 82
82 -
 83
83 -
 84
84 -
 85
85 -
 86
86 -
87
-
88
-
89
-
90
-
91
-
92
-
93
-
94
-
95
-
96
-
97
-
98
-
99
-
100
-
101
-
102
-
103
-
104
-
105
-
106
-
107
-
108
-
109
-
110
-
111
-
112
-
113
-
114
-
115
-
116
-
117
-
118
-
119
-
120
-
121
-
122
-
123
-
124
-
125
-
126
-
127
-
128
-
129
-
130
-
131
-
132
-
133
-
134
-
135
-
136
-
137
-
138
-
139
-
140
-
141
-
142
-
143
-
144
-
145
-
146
-
147
-
148
-
149
-
150
-
151
-
152
 |
 |

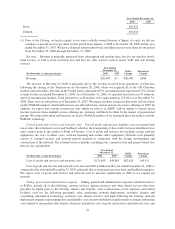
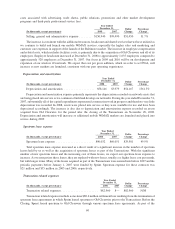
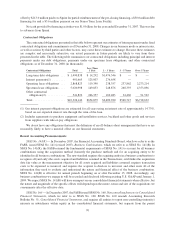
Th
e
i
ncrease was pr
i
mar
il
y
d
ue to t
h
ea
ddi
t
i
ona
ld
eprec
i
at
i
on expense assoc
i
ate
d
w
i
t
h
our cont
i
nue
d
networ
k
b
uild-out and the depreciation of CPE related to associated subscriber
g
rowth. The ma
j
orit
y
of the increase i
n
depreciation and amortization expense relates to the development of our pre-WiMAX network between 2007 an
d
2
008. Deprec
i
at
i
on an
d
amort
i
zat
i
on w
ill i
ncrease as a
ddi
t
i
ona
l
mo
bil
eW
i
MAX mar
k
ets are
l
aunc
h
e
d
an
d
p
l
ace
d
i
nto service durin
g
2009.
Spectrum lease expens
e
(
In thousands, except percenta
g
es) 2008 2007
Dollar
C
han
ge
P
ercenta
ge
C
han
g
e
Ye a
r
E
n
ded
December 31
,
S
p
ectrum
l
ease ex
p
ens
e
......................
$250,184 $190,942 $59,242 31.0%
T
ota
l
spectrum
l
ease expense
i
ncrease
d
as a
di
rect resu
l
to
f
as
i
gn
ifi
cant
i
ncrease
i
nt
h
e num
b
er o
f
spectru
m
leases held b
y
us as well as the acquisition of spectrum leases as part of the Transactions. With the si
g
nifican
t
n
umber of spectrum leases and the increasin
g
cost of these leases, we expect our spectrum lease expense to increase.
A
s we renegot
i
ate t
h
ese
l
eases t
h
ey are rep
l
ace
d
w
i
t
h
new
l
eases, usua
ll
yata
hi
g
h
er
l
ease cost per mont
h
,
b
ut w
i
t
h
l
on
g
er terms. Man
y
o
f
t
h
e
l
eases acqu
i
re
d
as part o
f
t
h
e Transact
i
ons were entere
di
nto
b
e
f
ore 2007 an
d
t
h
e per
i
o
dic
p
a
y
ments before Januar
y
1, 2007 were funded b
y
Sprint. Spectrum expense for these contracts was $21 million an
d
$
35 million in 2005 and 2006, respectively
.
I
nterest income
(
In thousands, except percentages
)
2008 200
7
D
o
ll
ar
Chang
e
P
ercentag
e
Change
Year Ende
d
December
31
,
I
nterest income .............................
$
18,569
$
65,736
$(
47,167
)(
71.8
)
%
T
he decrease was primaril
y
due to the reduction in interest rates earned on investments, as well as lower
p
r
i
nc
i
pa
lb
a
l
ances o
f
s
h
ort-term an
dl
ong-term
i
nvestments
h
e
ld d
ur
i
ng t
h
e year en
d
e
d
Decem
b
er 31, 200
8
c
ompare
d
to 2007.
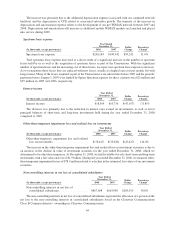
Other-than-temporary impairment loss and realized loss on investment
s
(
In thousands, except percentages
)
2008 2007
Dolla
r
C
hang
e
P
ercentag
e
C
hange
Yea
r
E
n
ded
December 31
,
O
t
h
er-t
h
an-temporary
i
mpa
i
rment
l
oss an
d
rea
li
ze
d
l
oss on
i
n
v
estments
.......................
$(
78,447
)$(
35,020
)$(
43,427
)
124.0
%
T
he increase in the other-than-temporary impairment loss and realized loss on investment securities is due to
an
i
ncrease
i
nt
h
e
d
ec
li
ne
i
nva
l
ue o
fi
nvestment secur
i
t
i
es
f
or t
h
e
y
ear en
d
e
d
Decem
b
er 31, 2008, w
hi
c
h
w
e
determined to be other than temporar
y
. At December 31, 2008, we held available-for-sale short-term and lon
g
-term
i
nvestments with a fair value and cost of $1.9 billion. Durin
g
the
y
ear ended December 31, 2008, we incurred other
-
t
han-temporary impairment losses of
$
78.4 million related to a decline in the estimated fair values of our investmen
t
s
ecurities
.
Non-controlling interests in net loss of consolidated subsidiaries
(
In thousands, except percenta
g
es) 2008 200
7
D
olla
r
Chan
g
e
Percenta
ge
Chan
g
e
Y
ea
rEn
ded
D
ecember
31,
Non-controllin
g
interests in net loss of
co
n
so
li
dated subs
i
d
i
a
ri
es
..................
$
867,608 $663,098 $204,510 30.8%
Th
e non-contro
lli
n
gi
nterests
i
n net
l
oss o
f
conso
lid
ate
d
su
b
s
idi
ar
i
es represent t
h
ea
ll
ocat
i
on o
f
a port
i
on o
f
t
h
e
n
et
l
oss to t
h
e non-contro
lli
n
gi
nterests
i
n conso
lid
ate
d
su
b
s
idi
ar
i
es
b
ase
d
on t
h
eC
l
earw
i
re Commun
i
cat
i
on
s
Class B Common Interests’ ownershi
p
in Clearwire Communications
.
64