CVS 2015 Annual Report Download - page 97
Download and view the complete annual report
Please find page 97 of the 2015 CVS annual report below. You can navigate through the pages in the report by either clicking on the pages listed below, or by using the keyword search tool below to find specific information within the annual report.-
 1
1 -
2
-
3
-
4
-
5
-
6
-
7
-
8
-
9
-
10
-
11
-
12
-
13
-
14
-
15
-
16
-
17
-
18
-
19
-
20
-
21
-
22
-
23
-
24
-
25
-
26
-
27
-
28
-
29
-
30
-
31
-
32
-
33
-
34
-
35
-
36
-
37
-
38
-
39
-
40
-
41
-
42
-
43
-
44
-
45
-
46
-
47
-
48
-
49
-
50
-
51
-
52
-
53
-
54
-
55
-
56
-
57
-
58
-
59
-
60
-
61
-
62
-
63
-
64
-
65
-
66
-
67
-
68
-
69
-
70
-
71
-
72
-
73
-
74
-
75
-
76
-
77
-
78
-
79
-
80
-
81
-
82
-
83
-
84
-
85
-
86
-
 87
87 -
 88
88 -
 89
89 -
 90
90 -
 91
91 -
 92
92 -
 93
93 -
 94
94 -
 95
95 -
 96
96 -
 97
97 -
 98
98 -
 99
99 -
 100
100 -
 101
101 -
 102
102 -
 103
103 -
 104
104
 |
 |

95
2015 Annual Report
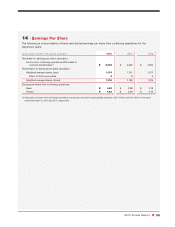
14 | Earnings Per Share
The following is a reconciliation of basic and diluted earnings per share from continuing operations for the
respective years:
IN MILLIONS, EXCEPT PER SHARE AMOUNTS 2015 2014 2013
Numerator for earnings per share calculation:
Income from continuing operations attributable to
common stockholders (1)
$ 5,202
$ 4,626 $ 4,600
Denominator for earnings per share calculation:
Weighted average shares, basic
1,118
1,161 1,217
Effect of dilutive securities
8
8 9
Weighted average shares, diluted
1,126
1,169 1,226
Earnings per share from continuing operations:
Basic
$ 4.65
$ 3.98 $ 3.78
Diluted
$ 4.62
$ 3.96 $ 3.75
(1) Comprised of income from continuing operations less amounts allocable to participating securities of $27 million and $19 million for the years
ended December 31, 2015 and 2014, respectively.