CVS 2015 Annual Report Download - page 34
Download and view the complete annual report
Please find page 34 of the 2015 CVS annual report below. You can navigate through the pages in the report by either clicking on the pages listed below, or by using the keyword search tool below to find specific information within the annual report.-
 1
1 -
2
-
3
-
4
-
5
-
6
-
7
-
8
-
9
-
10
-
11
-
12
-
13
-
14
-
15
-
16
-
17
-
18
-
19
-
20
-
21
-
22
-
23
-
 24
24 -
 25
25 -
 26
26 -
 27
27 -
 28
28 -
 29
29 -
 30
30 -
 31
31 -
 32
32 -
 33
33 -
 34
34 -
 35
35 -
 36
36 -
 37
37 -
 38
38 -
 39
39 -
 40
40 -
 41
41 -
 42
42 -
 43
43 -
 44
44 -
45
-
46
-
47
-
48
-
49
-
50
-
51
-
52
-
53
-
54
-
55
-
56
-
57
-
58
-
59
-
60
-
61
-
62
-
63
-
64
-
65
-
66
-
67
-
68
-
69
-
70
-
71
-
72
-
73
-
74
-
75
-
76
-
77
-
78
-
79
-
80
-
81
-
82
-
83
-
84
-
85
-
86
-
87
-
88
-
89
-
90
-
91
-
92
-
93
-
94
-
95
-
96
-
97
-
98
-
99
-
100
-
101
-
102
-
103
-
104
 |
 |

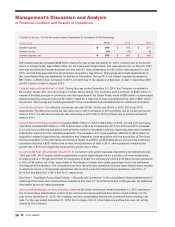
Management’s Discussion and Analysis
of Financial Condition and Results of Operations
32 CVS Health
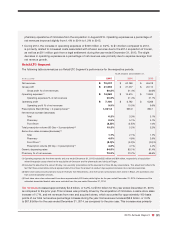
driven by a same store sales increase of 2.1% and net revenues from new stores, which accounted for approximately
140 basis points of our total net revenue percentage increase during the year. Additionally, in 2015, 2014 and 2013
we continued to see a positive impact on our net revenues due to the growth of our Maintenance Choice program.
As you review our Retail/LTC Segment’s performance in this area, we believe you should consider the following
important information:
• Front store same store sales declined 5.0% in the year ended December 31, 2015, as compared to the prior year.
The decrease is primarily due to the Company’s decision to stop selling tobacco products and softer customer
traffic. The decrease was partially offset by an increase in basket size. On a comparable basis, front store same
store sales would have been approximately 520 basis points higher for the year ended December 31, 2015 if
tobacco and the estimated associated basket sales were excluded from the year ended December 31, 2014.
• Pharmacy same store sales rose 4.5% in the year ended December 31, 2015, as compared to the prior year.
Pharmacy same store sales were positively impacted by same store script growth of 4.8%, partially offset by
the impact of the increase in generic dispensing and reimbursement pressure.
• Pharmacy revenues continue to be negatively impacted by the conversion of brand name drugs to equivalent
generic drugs, which typically have a lower selling price. Pharmacy same store sales were negatively impacted by
approximately 390 and 160 basis points for the years ended December 31, 2015 and 2014, respectively, due to
recent generic introductions. The increase in the impact from 2014 to 2015 was primarily due to a larger impact
from new generic drug introductions. In addition, our pharmacy revenue growth has also been affected by
continued reimbursement pressure, the lack of significant new brand name drug introductions, as well as an
increase in the number of over-the-counter remedies that were historically only available by prescription.
• As of December 31, 2015, we operated 9,655 retail stores, including the 1,672 locations in Target stores, com-
pared to 7,822 retail stores as of December 31, 2014 and 7,660 retail stores as of December 31, 2013. Total net
revenues from new and acquired stores contributed approximately 1.6%, 1.1% and 1.0% to our total net revenue
percentage increase in 2015, 2014, and 2013, respectively.
• Pharmacy revenue growth continued to benefit from increased utilization by Medicare Part D beneficiaries, our
ability to attract and retain managed care customers and favorable industry trends. These trends include an
aging American population; many “baby boomers” are now in their fifties and sixties and are consuming a greater
number of prescription drugs, as well as expanded coverage from the Patient Protection and Affordable Care
Act and the Health Care and Education Reconciliation Act (collectively, “ACA”). In addition, the increased use of
pharmaceuticals as the first line of defense for individual health care also contributed to the growing demand for
pharmacy services. We believe these favorable industry trends will continue.
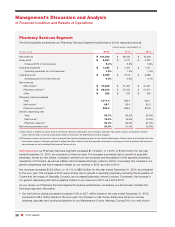
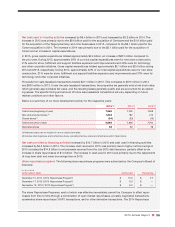
Gross profit
in our Retail/LTC Segment includes net revenues less the cost of merchandise sold during the reporting
period and the related purchasing costs, warehousing costs, delivery costs and actual and estimated inventory losses.
Gross profit increased $715 million, or 3.4%, to approximately $22.0 billion in the year ended December 31, 2015,
as compared to the prior year. Gross profit as a percentage of net revenues decreased to 30.5% in year ended
December 31, 2015, from 31.4% in 2014. Gross profit increased $1.2 billion, or 5.8%, to $21.3 billion for the year
ended December 31, 2014, as compared to the prior year. Gross profit as a percentage of net revenues increased
to 31.4% for the year ended December 31, 2014, compared to 30.6% for the prior year.
The increase in gross profit dollars in the year ended December 31, 2015, was primarily driven by the addition of
LTC, same store sales and new store sales, increased generic dispensing, as well as favorable purchasing econom-
ics, partially offset by continued reimbursement pressure. The increase in gross profit dollars for the year ended
December 31, 2014, was primarily driven by increases in the generic dispensing rate, same store sales and new
store sales, as well as favorable purchasing economics. The decrease in gross profit as a percentage of net reve-
nues in 2015 was primarily driven by a decline in pharmacy margins due to continued reimbursement pressure,