CVS 2015 Annual Report Download - page 35
Download and view the complete annual report
Please find page 35 of the 2015 CVS annual report below. You can navigate through the pages in the report by either clicking on the pages listed below, or by using the keyword search tool below to find specific information within the annual report.-
 1
1 -
2
-
3
-
4
-
5
-
6
-
7
-
8
-
9
-
10
-
11
-
12
-
13
-
14
-
15
-
16
-
17
-
18
-
19
-
20
-
21
-
22
-
23
-
24
-
 25
25 -
 26
26 -
 27
27 -
 28
28 -
 29
29 -
 30
30 -
 31
31 -
 32
32 -
 33
33 -
 34
34 -
 35
35 -
 36
36 -
 37
37 -
 38
38 -
 39
39 -
 40
40 -
 41
41 -
 42
42 -
 43
43 -
 44
44 -
 45
45 -
46
-
47
-
48
-
49
-
50
-
51
-
52
-
53
-
54
-
55
-
56
-
57
-
58
-
59
-
60
-
61
-
62
-
63
-
64
-
65
-
66
-
67
-
68
-
69
-
70
-
71
-
72
-
73
-
74
-
75
-
76
-
77
-
78
-
79
-
80
-
81
-
82
-
83
-
84
-
85
-
86
-
87
-
88
-
89
-
90
-
91
-
92
-
93
-
94
-
95
-
96
-
97
-
98
-
99
-
100
-
101
-
102
-
103
-
104
 |
 |

33
2015 Annual Report
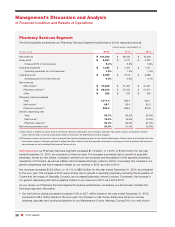
partially offset by favorable pharmacy purchasing economics, as well as increased front store margins due to changes
in the mix of products sold. The increase in gross profit as a percentage of net revenues in 2014 was primarily driven
by increased pharmacy margins due to the positive impact of increased generic dispensing rates and increased front
store margins, partially offset by continued reimbursement pressure. The increase in gross profit as a percentage of
net revenues in 2014 was also driven by the removal of tobacco products from our stores.
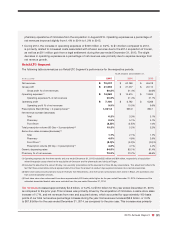
As you review our Retail/LTC Segment’s performance in this area, we believe you should consider the following
important information:
• Front store revenues as a percentage of total net revenues for the years ended December 31, 2015, 2014 and
2013 were 26.5%, 28.8% and 30.5%, respectively. The decline in front store revenues as a percentage of total net
revenues in 2015 and 2014 was largely due to the removal of tobacco products and the associated basket sales.
On average, our gross profit on front store revenues is generally higher than our gross profit on pharmacy reve-
nues. Pharmacy revenues as a percentage of total net revenues increased approximately 220, 120 and 60 basis
points in the years ended December 31, 2015, 2014 and 2013, respectively. This was due to pharmacy revenues
growing faster than front store revenues, as well as the acquisition of Omnicare. The mix effect from a higher
proportion of pharmacy sales had a negative effect on our overall gross profit for the years ended December 31,
2015, 2014 and 2013, respectively. This negative effect was partially offset by increased generic drug dispensing
rates, the removal of tobacco products from our stores, favorable purchasing economics and increased store
brand penetration.
• During the year ended December 31, 2014, our front store gross profit as a percentage of net revenues increased
compared to the prior year. The increase is primarily related to a change in the mix of products sold, including the
removal of tobacco products from our stores, and higher store brand sales.
• Gross profit dollars and margin for the year ended December 31, 2014 were positively impacted by $53 million
related to the favorable resolution of previously proposed retroactive reimbursement rate changes in the State of
California’s Medicaid program.
• Our pharmacy gross profit rates have been adversely affected by the efforts of managed care organizations,
PBMs and governmental and other third party payors to reduce their prescription drug costs, as well as changes
in the mix of our business within pharmacy. In the event this trend accelerates, we may not be able to sustain our
current rate of revenue growth and gross profit dollars could be adversely impacted. The increased use of generic
drugs has positively impacted our gross profit but has resulted in third party payors augmenting their efforts to
reduce reimbursement payments to retail pharmacies for prescriptions. This trend, which we expect to continue,
reduces the benefit we realize from brand to generic product conversions.
• ACA made several significant changes to Medicaid rebates and to reimbursement. One of these changes was the
revision of the definition of Average Manufacturer Price (“AMP”) and the reimbursement formula for multi-source
drugs. Changes in reporting of AMP or other adjustments that may be made regarding the reimbursement of drug
payments by Medicaid and Medicare could impact our pricing to customers and other payors and/or could impact
our ability to negotiate discounts or rebates with manufacturers, wholesalers, PBMs or retail and mail pharmacies.
See “Efforts to reduce reimbursement levels and alter health care financing practices” in Part I, Item 1A, Risk
Factors within our 2015 Form 10-K, for additional information.
Operating expenses
in our Retail/LTC Segment include store payroll, store employee benefits, store occupancy
costs, selling expenses, advertising expenses, depreciation and amortization expense and certain administra-
tive expenses.
Operating expenses increased $347 million, or 2.4% to $14.9 billion, or 20.6% as a percentage of net revenues, in
the year ended December 31, 2015, as compared to $14.5 billion, or 21.4% as a percentage of net revenues, in the
prior year. Operating expenses increased $671 million, or 4.8%, to $14.5 billion, or 21.4% as a percentage of net
revenues, in the year ended December 31, 2014, as compared to $13.8 billion, or 21.1% as a percentage of net