CVS 2015 Annual Report Download - page 31
Download and view the complete annual report
Please find page 31 of the 2015 CVS annual report below. You can navigate through the pages in the report by either clicking on the pages listed below, or by using the keyword search tool below to find specific information within the annual report.-
 1
1 -
2
-
3
-
4
-
5
-
6
-
7
-
8
-
9
-
10
-
11
-
12
-
13
-
14
-
15
-
16
-
17
-
18
-
19
-
20
-
 21
21 -
 22
22 -
 23
23 -
 24
24 -
 25
25 -
 26
26 -
 27
27 -
 28
28 -
 29
29 -
 30
30 -
 31
31 -
 32
32 -
 33
33 -
 34
34 -
 35
35 -
 36
36 -
 37
37 -
 38
38 -
 39
39 -
 40
40 -
 41
41 -
42
-
43
-
44
-
45
-
46
-
47
-
48
-
49
-
50
-
51
-
52
-
53
-
54
-
55
-
56
-
57
-
58
-
59
-
60
-
61
-
62
-
63
-
64
-
65
-
66
-
67
-
68
-
69
-
70
-
71
-
72
-
73
-
74
-
75
-
76
-
77
-
78
-
79
-
80
-
81
-
82
-
83
-
84
-
85
-
86
-
87
-
88
-
89
-
90
-
91
-
92
-
93
-
94
-
95
-
96
-
97
-
98
-
99
-
100
-
101
-
102
-
103
-
104
 |
 |

29
2015 Annual Report
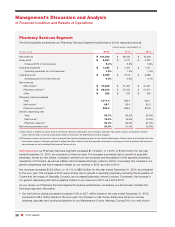
claims processed decreased 1.1% to 82.4 million claims. The decrease in mail choice claims was driven by a
decline in traditional mail volumes, which was mostly offset by growth in our Maintenance Choice program and
specialty pharmacy.
• During 2015 and 2014, our average revenue per mail choice claim increased by 17.0% and 26.8%, compared
to 2014 and 2013, respectively. The increase in 2015 was primarily due to growth in specialty pharmacy. The
increase in 2014 was primarily due to the acquisition of Coram and drug inflation particularly in specialty phar-
macy, partially offset by increases in the percentage of generic prescription drugs dispensed and changes in
client pricing.
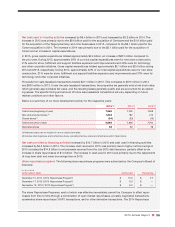
• Our pharmacy network claims processed increased 9.0% to 926.2 million claims in the year ended December 31,
2015, compared to 849.6 million claims in the prior year. This increase was primarily due to net new business.
During 2014, our pharmacy network claims processed increased 3.8% to 849.6 million compared to 818.8 million
pharmacy network claims processed in 2013. This increase was primarily due to net new business and growth in
Managed Medicaid, partially offset by a decrease in Medicare Part D claims. Medicare Part D claims were
negatively affected by the CMS sanctions that were in place during 2013.
• Our average revenue per pharmacy network claim processed remained flat for the year ended December 31,
2015 as compared to the prior year. During 2014, our average revenue per pharmacy network claim processed
increased by 7.5%, compared to 2013. This increase was primarily due to drug inflation and changes in the drug
mix, partially offset by increases in the generic dispensing rate.
• Our mail choice generic dispensing rate was 76.4%, 74.6% and 72.6% in the years ended December 31, 2015,
2014 and 2013, respectively. Our pharmacy network generic dispensing rate increased to 84.4% in the year ended
December 31, 2015, compared to 83.0% in the prior year. During 2014, our pharmacy network generic dispensing
rate increased to 83.0% compared to our pharmacy network generic dispensing rate of 81.3% in 2013. These
continued increases in mail choice and pharmacy network generic dispensing rates were primarily due to the
impact of new generic drug introductions, and our continuous efforts to encourage plan members to use generic
drugs when they are available. We believe our generic dispensing rates will continue to increase in future periods,
albeit at a slower pace. This increase will be affected by, among other things, the number of new generic drug
introductions and our success at encouraging plan members to utilize generic drugs when they are available and
clinically appropriate.
• We completed the rollout of Specialty ConnectTM in May 2014, which integrates the Company’s specialty phar-
macy mail and retail capabilities, providing members with the choice to bring their specialty prescriptions to any
CVS Pharmacy® location. Whether submitted through our mail order pharmacy or at CVS Pharmacy, all prescrip-
tions are filled through the Company’s specialty mail order pharmacies, so all revenue from this specialty
prescription services program is recorded within the Pharmacy Services Segment.
• The Pharmacy Services Segment recognizes revenues from its pharmacy network transactions based on individ-
ual contract terms. Our Pharmacy Services Segment contracts are predominantly accounted for using the gross
method. See the “Revenue Recognition” description under “Critical Accounting Policies” later in this section for
further information on our revenue recognition policy.
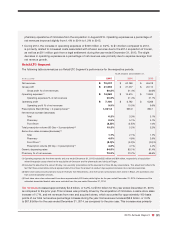
Gross profit
in our Pharmacy Services Segment includes net revenues less cost of revenues. Cost of revenues
includes (i) the cost of pharmaceuticals dispensed, either directly through our mail service and specialty retail
pharmacies or indirectly through our pharmacy network, (ii) shipping and handling costs and (iii) the operating costs
of our mail service dispensing pharmacies, customer service operations and related information technology support.
Gross profit increased $456 million, or 9.6% to $5.2 billion in the year ended December 31, 2015, as compared to
the prior year. Gross profit as a percentage of net revenues decreased to 5.2% for the year ended December 31,
2015, compared to 5.4% in the prior year. The increase in gross profit dollars in the year ended December 31, 2015
was primarily due to volume increases and higher generic dispensing, as well as favorable purchasing and rebate