CVS 2015 Annual Report Download - page 37
Download and view the complete annual report
Please find page 37 of the 2015 CVS annual report below. You can navigate through the pages in the report by either clicking on the pages listed below, or by using the keyword search tool below to find specific information within the annual report.-
 1
1 -
2
-
3
-
4
-
5
-
6
-
7
-
8
-
9
-
10
-
11
-
12
-
13
-
14
-
15
-
16
-
17
-
18
-
19
-
20
-
21
-
22
-
23
-
24
-
25
-
26
-
 27
27 -
 28
28 -
 29
29 -
 30
30 -
 31
31 -
 32
32 -
 33
33 -
 34
34 -
 35
35 -
 36
36 -
 37
37 -
 38
38 -
 39
39 -
 40
40 -
 41
41 -
 42
42 -
 43
43 -
 44
44 -
 45
45 -
 46
46 -
 47
47 -
48
-
49
-
50
-
51
-
52
-
53
-
54
-
55
-
56
-
57
-
58
-
59
-
60
-
61
-
62
-
63
-
64
-
65
-
66
-
67
-
68
-
69
-
70
-
71
-
72
-
73
-
74
-
75
-
76
-
77
-
78
-
79
-
80
-
81
-
82
-
83
-
84
-
85
-
86
-
87
-
88
-
89
-
90
-
91
-
92
-
93
-
94
-
95
-
96
-
97
-
98
-
99
-
100
-
101
-
102
-
103
-
104
 |
 |

35
2015 Annual Report
Net cash used in investing activities
increased by $9.4 billion in 2015 and increased by $2.2 billion in 2014. The
increase in 2015 was primarily due to the $9.6 billion paid for the acquisition of Omnicare and the $1.9 billion paid
for the acquisition of the Target pharmacy and clinic businesses in 2015, compared to the $2.1 billion paid for the
Coram acquisition in 2014. The increase in 2014 was primarily due to the $2.1 billion paid for the acquisition of
Coram and an increase in capital expenditures.
In 2015, gross capital expenditures totaled approximately $2.4 billion, an increase of $231 million compared to
the prior year. During 2015, approximately 36% of our total capital expenditures were for new store construction,
21% were for store, fulfillment and support facilities expansion and improvements and 43% were for technology
and other corporate initiatives. Gross capital expenditures totaled approximately $2.1 billion and $2.0 billion during
2014 and 2013, respectively. During 2014, approximately 42% of our total capital expenditures were for new store
construction, 21% were for store, fulfillment and support facilities expansion and improvements and 37% were for
technology and other corporate initiatives.
Proceeds from sale-leaseback transactions totaled $411 million in 2015. This compares to $515 million in 2014
and $600 million in 2013. Under the sale-leaseback transactions, the properties are generally sold at net book value,
which generally approximates fair value, and the resulting leases generally qualify and are accounted for as operat-
ing leases. The specific timing and amount of future sale-leaseback transactions will vary depending on future
market conditions and other factors.
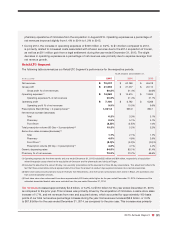
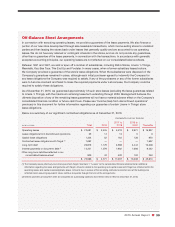
Below is a summary of our store development activity for the respective years:
2015 (2) 2014 (2) 2013 (2)
Total stores (beginning of year)
7,866
7,702 7,508
New and acquired stores (1)
1,833
187 213
Closed stores (1)
(34)
(23) (19)
Total stores (end of year)
9,665
7,866 7,702
Relocated stores
58
60 78
(1) Relocated stores are not included in new or closed store totals.
(2) Includes retail drugstores, onsite pharmacy stores, specialty pharmacy stores and pharmacies within Target stores.
Net cash provided by financing activities
increased by $10.7 billion in 2015 and cash used in financing activities
increased by $4.5 billion in 2014. The increase cash received in 2015 was primarily due to higher net borrowings in
2015 including the $14.8 billion in net proceeds received from the July 2015 debt issuance, partially offset by an
increase in share repurchases of $1.0 billion. The increase in cash used in 2014 was primarily due to the repayments
of long-term debt and lower borrowings than in 2013.
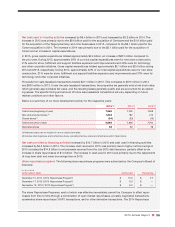
Share repurchase programs
The following share repurchase programs were authorized by the Company’s Board of
Directors:
IN BILLIONS
Authorization Date Authorized Remaining
December 15, 2014 (“2014 Repurchase Program”) $ 10.0 $ 7.7
December 17, 2013 (“2013 Repurchase Program”) $ 6.0 $ —
September 19, 2012 (“2012 Repurchase Program”) $ 6.0 $ —
The share Repurchase Programs, each of which was effective immediately, permit the Company to effect repur-
chases from time to time through a combination of open market repurchases, privately negotiated transactions,
accelerated share repurchase (“ASR”) transactions, and/or other derivative transactions. The 2014 Repurchase