CVS 2015 Annual Report Download - page 58
Download and view the complete annual report
Please find page 58 of the 2015 CVS annual report below. You can navigate through the pages in the report by either clicking on the pages listed below, or by using the keyword search tool below to find specific information within the annual report.-
 1
1 -
2
-
3
-
4
-
5
-
6
-
7
-
8
-
9
-
10
-
11
-
12
-
13
-
14
-
15
-
16
-
17
-
18
-
19
-
20
-
21
-
22
-
23
-
24
-
25
-
26
-
27
-
28
-
29
-
30
-
31
-
32
-
33
-
34
-
35
-
36
-
37
-
38
-
39
-
40
-
41
-
42
-
43
-
44
-
45
-
46
-
47
-
 48
48 -
 49
49 -
 50
50 -
 51
51 -
 52
52 -
 53
53 -
 54
54 -
 55
55 -
 56
56 -
 57
57 -
 58
58 -
 59
59 -
 60
60 -
 61
61 -
 62
62 -
 63
63 -
 64
64 -
 65
65 -
 66
66 -
 67
67 -
 68
68 -
69
-
70
-
71
-
72
-
73
-
74
-
75
-
76
-
77
-
78
-
79
-
80
-
81
-
82
-
83
-
84
-
85
-
86
-
87
-
88
-
89
-
90
-
91
-
92
-
93
-
94
-
95
-
96
-
97
-
98
-
99
-
100
-
101
-
102
-
103
-
104
 |
 |

56 CVS Health
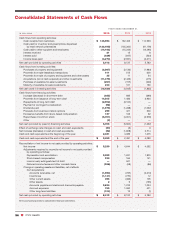
YEAR ENDED DECEMBER 31,
IN MILLIONS 2015 2014 2013
Cash flows from operating activities:
Cash receipts from customers
$ 148,954
$ 132,406 $ 114,993
Cash paid for inventory and prescriptions dispensed
by retail network pharmacies
(122,498)
(105,362) (91,178)
Cash paid to other suppliers and employees
(14,162)
(15,344) (14,295)
Interest received
21
15 8
Interest paid
(629)
(647) (534)
Income taxes paid
(3,274)
(2,931) (3,211)
Net cash provided by operating activities
8,412
8,137 5,783
Cash flows from investing activities:
Purchases of property and equipment
(2,367)
(2,136) (1,984)
Proceeds from sale-leaseback transactions
411
515 600
Proceeds from sale of property and equipment and other assets
35
11 54
Acquisitions (net of cash acquired) and other investments
(11,475)
(2,439) (415)
Purchase of available-for-sale investments
(267)
(157) (226)
Maturity of available-for-sale investments
243
161 136
Net cash used in investing activities
(13,420)
(4,045) (1,835)
Cash flows from financing activities:
Increase (decrease) in short-term debt
(685)
685 (690)
Proceeds from issuance of long-term debt
14,805
1,483 3,964
Repayments of long-term debt
(2,902)
(3,100) —
Payment of contingent consideration
(58)
— —
Dividends paid
(1,576)
(1,288) (1,097)
Proceeds from exercise of stock options
299
421 500
Excess tax benefits from stock-based compensation
127
106 62
Repurchase of common stock
(5,001)
(4,001) (3,976)
Other
(3)
— —
Net cash provided by (used in) financing activities
5,006
(5,694) (1,237)
Effect of exchange rate changes on cash and cash equivalents
(20)
(6) 3
Net increase (decrease) in cash and cash equivalents
(22)
(1,608) 2,714
Cash and cash equivalents at the beginning of the year
2,481
4,089 1,375
Cash and cash equivalents at the end of the year
$ 2,459
$ 2,481 $ 4,089
Reconciliation of net income to net cash provided by operating activities:
Net income
$ 5,239
$ 4,644 $ 4,592
Adjustments required to reconcile net income to net cash provided
by operating activities:
Depreciation and amortization
2,092
1,931 1,870
Stock-based compensation
230
165 141
Loss on early extinguishment of debt
—
521 —
Deferred income taxes and other noncash items
(266)
(58) (86)
Change in operating assets and liabilities, net of effects
from acquisitions:
Accounts receivable, net
(1,594)
(737) (2,210)
Inventories
(1,141)
(770) 12
Other current assets
355
(383) 105
Other assets
2
9 (135)
Accounts payable and claims and discounts payable
2,834
1,742 1,024
Accrued expenses
765
1,060 471
Other long-term liabilities
(104)
13 (1)
Net cash provided by operating activities
$ 8,412
$ 8,137 $ 5,783
See accompanying notes to consolidated financial statements.
Consolidated Statements of Cash Flows