CVS 2015 Annual Report Download - page 27
Download and view the complete annual report
Please find page 27 of the 2015 CVS annual report below. You can navigate through the pages in the report by either clicking on the pages listed below, or by using the keyword search tool below to find specific information within the annual report.-
 1
1 -
2
-
3
-
4
-
5
-
6
-
7
-
8
-
9
-
10
-
11
-
12
-
13
-
14
-
15
-
16
-
 17
17 -
 18
18 -
 19
19 -
 20
20 -
 21
21 -
 22
22 -
 23
23 -
 24
24 -
 25
25 -
 26
26 -
 27
27 -
 28
28 -
 29
29 -
 30
30 -
 31
31 -
 32
32 -
 33
33 -
 34
34 -
 35
35 -
 36
36 -
 37
37 -
38
-
39
-
40
-
41
-
42
-
43
-
44
-
45
-
46
-
47
-
48
-
49
-
50
-
51
-
52
-
53
-
54
-
55
-
56
-
57
-
58
-
59
-
60
-
61
-
62
-
63
-
64
-
65
-
66
-
67
-
68
-
69
-
70
-
71
-
72
-
73
-
74
-
75
-
76
-
77
-
78
-
79
-
80
-
81
-
82
-
83
-
84
-
85
-
86
-
87
-
88
-
89
-
90
-
91
-
92
-
93
-
94
-
95
-
96
-
97
-
98
-
99
-
100
-
101
-
102
-
103
-
104
 |
 |

25
2015 Annual Report
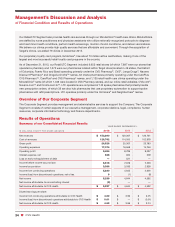
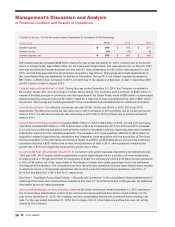
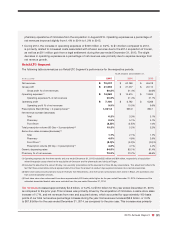
Net revenues
increased $13.9 billion in 2015 compared to 2014, and increased $12.6 billion in 2014 compared to
2013. As you review our performance in this area, we believe you should consider the following important information:
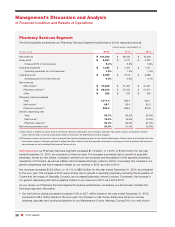
• During 2015, net revenues in our Pharmacy Services Segment increased 13.5% and net revenues in our
Retail/LTC Segment increased 6.2% compared to the prior year.
• During 2014, net revenues in our Pharmacy Services Segment increased by 16.1% and net revenues in our
Retail/LTC Segment increased 3.3% compared to the prior year.
• In 2015 and 2014, the impact from net new business grew for the Pharmacy Services Segment. The increase in
our generic dispensing rates in both of our operating segments continued to have a negative effect on net revenue
in 2015 as compared to 2014, as well as in 2014 as compared to 2013.
• Both segments benefited from the Omnicare acquisition that occurred in August 2015.
Please see the Segment Analysis later in this document for additional information about our net revenues.
Gross profit
increased $1.2 billion, or 4.6% in 2015, to $26.5 billion, as compared to $25.4 billion in 2014. Gross
profit increased $1.6 billion, or 6.7% in 2014, to $25.4 billion, as compared to $23.8 billion in 2013. Gross profit as
a percentage of net revenues declined to 17.3%, as compared to 18.2% in 2014 and 18.8% in 2013.
• During 2015, gross profit in our Pharmacy Services Segment and Retail/LTC Segment increased by 9.6% and
3.4%, respectively, compared to the prior year. For the year ended December 31, 2015, gross profit as a percent
of net revenues in our Pharmacy Services Segment and Retail/LTC Segment was 5.2% and 30.5%, respectively.
• During 2014, gross profit in our Pharmacy Services Segment and Retail/LTC Segment increased by 12.6% and
5.8%, respectively, compared to the prior year. For the year ended December 31, 2014, gross profit as a percent
of net revenues in our Pharmacy Services Segment and Retail/LTC Segment was 5.4% and 31.4%, respectively.
• The increased weighting toward the Pharmacy Services Segment, which has a lower gross profit than the Retail/
LTC Segment, resulted in a decline in consolidated gross profit as a percent of net revenues in 2015 as compared
to 2014. In addition, gross profit for 2015, 2014 and 2013 has been negatively impacted by price compression in
the Pharmacy Services Segment and reimbursement pressure in the Retail/LTC Segment.
• Our gross profit continued to benefit from the increased utilization of generic drugs (which normally yield a higher
gross profit rate than equivalent brand name drugs) in both the Pharmacy Services and Retail/LTC segments for
2013 through 2015, partially offsetting the negative impacts described above.
Please see the Segment Analysis later in this document for additional information about our gross profit.
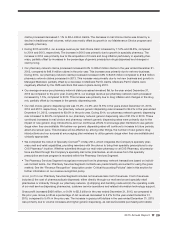
Operating expenses
increased $506 million, or 3.0%, in the year ended December 31, 2015, as compared to the
prior year. Operating expenses as a percent of net revenues declined to 11.1% in the year ended December 31,
2015 compared to 11.9% in the prior year. The increase in operating expense dollars in the year ended December 31,
2015 was primarily due to incremental store operating costs associated with a higher store count, the Omnicare
acquisition in August 2015 and the acquisition of the Target pharmacy and clinic businesses in December 2015. The
decrease in operating expenses as a percent of net revenues in 2015 is primarily due to expense leverage from net
revenue growth.
Operating expenses
increased $882 million, or 5.2%, in the year ended December 31, 2014 as compared to the
prior year. Operating expenses as a percent of net revenues declined to 11.9% in the year ended December 31,
2014 compared to 12.4% in the prior year. The increase in operating expense dollars in the year ended December 31,
2014 was primarily due to incremental store operating costs associated with a higher store count, as well as legal
costs and strategic initiatives as compared to the prior year. Additionally, the year ended December 31, 2013
included a $72 million gain on a legal settlement. The improvement in operating expenses as a percent of net
revenues in 2014 is primarily due to expense leverage from net revenue growth and disciplined expense control.
Please see the Segment Analysis later in this document for additional information about operating expenses.