CVS 2015 Annual Report Download - page 100
Download and view the complete annual report
Please find page 100 of the 2015 CVS annual report below. You can navigate through the pages in the report by either clicking on the pages listed below, or by using the keyword search tool below to find specific information within the annual report.-
 1
1 -
2
-
3
-
4
-
5
-
6
-
7
-
8
-
9
-
10
-
11
-
12
-
13
-
14
-
15
-
16
-
17
-
18
-
19
-
20
-
21
-
22
-
23
-
24
-
25
-
26
-
27
-
28
-
29
-
30
-
31
-
32
-
33
-
34
-
35
-
36
-
37
-
38
-
39
-
40
-
41
-
42
-
43
-
44
-
45
-
46
-
47
-
48
-
49
-
50
-
51
-
52
-
53
-
54
-
55
-
56
-
57
-
58
-
59
-
60
-
61
-
62
-
63
-
64
-
65
-
66
-
67
-
68
-
69
-
70
-
71
-
72
-
73
-
74
-
75
-
76
-
77
-
78
-
79
-
80
-
81
-
82
-
83
-
84
-
85
-
86
-
87
-
88
-
89
-
 90
90 -
 91
91 -
 92
92 -
 93
93 -
 94
94 -
 95
95 -
 96
96 -
 97
97 -
 98
98 -
 99
99 -
 100
100 -
 101
101 -
 102
102 -
 103
103 -
 104
104
 |
 |
CVS Health
98
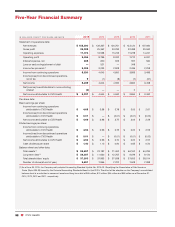
Five-Year Financial Summary
IN MILLIONS, EXCEPT PER SHARE AMOUNTS 2015 2014 2013 2012 2011
Statement of operations data:
Net revenues
$ 153,290
$ 139,367 $ 126,761 $ 123,120 $ 107,080
Gross profit
26,528
25,367 23,783 22,488 20,562
Operating expenses
17,074
16,568 15,746 15,278 14,231
Operating profit
9,454
8,799 8,037 7,210 6,331
Interest expense, net
838
600 509 557 584
Loss on early extinguishment of debt
—
521 — 348 —
Income tax provision (1)
3,386
3,033 2,928 2,436 2,258
Income from continuing operations
5,230
4,645 4,600 3,869 3,489
Income (loss) from discontinued operations,
net of tax
9
(1) (8) (7) (31)
Net income
5,239
4,644 4,592 3,862 3,458
Net (income) loss attributable to noncontrolling
interest
(2)
— — 2 4
Net income attributable to CVS Health
$ 5,237
$ 4,644 $ 4,592 $ 3,864 $ 3,462
Per share data:
Basic earnings per share:
Income from continuing operations
attributable to CVS Health
$ 4.65
$ 3.98 $ 3.78 $ 3.05 $ 2.61
Income (loss) from discontinued operations
attributable to CVS Health
$ 0.01
$ — $ (0.01) $ (0.01) $ (0.02)
Net income attributable to CVS Health
$ 4.66
$ 3.98 $ 3.77 $ 3.04 $ 2.59
Diluted earnings per share:
Income from continuing operations
attributable to CVS Health
$ 4.62
$ 3.96 $ 3.75 $ 3.02 $ 2.59
Income (loss) from discontinued operations
attributable to CVS Health
$ 0.01
$ — $ (0.01) $ (0.01) $ (0.02)
Net income attributable to CVS Health
$ 4.63
$ 3.96 $ 3.74 $ 3.02 $ 2.57
Cash dividends per share
$ 1.40
$ 1.10 $ 0.90 $ 0.65 $ 0.50
Balance sheet and other data:
Total assets (1)
$ 93,657
$ 74,187 $ 71,452 $ 66,167 $ 64,794
Long-term debt (1)
$ 26,267
$ 11,630 $ 12,767 $ 9,079 $ 9,150
Total shareholders’ equity
$ 37,203
$ 37,963 $ 37,938 $ 37,653 $ 38,014
Number of stores (at end of year)
9,681
7,866 7,702 7,508 7,388
(1) As of June 30, 2015, the Company early adopted Accounting Standard Update No. 2015-03,
Simplifying the Presentation of Debt Issuance
Costs (Topic 835-30)
issued by the Financial Accounting Standards Board in April 2015. The effect of the adoption on the Company’s consolidated
balance sheet is a reduction in noncurrent assets and long-term debt of $65 million, $74 million, $54 million and $58 million as of December 31,
2014, 2013, 2012 and 2011, respectively.