CVS 2015 Annual Report Download - page 4
Download and view the complete annual report
Please find page 4 of the 2015 CVS annual report below. You can navigate through the pages in the report by either clicking on the pages listed below, or by using the keyword search tool below to find specific information within the annual report.-
 1
1 -
 2
2 -
 3
3 -
 4
4 -
 5
5 -
 6
6 -
 7
7 -
 8
8 -
 9
9 -
 10
10 -
 11
11 -
 12
12 -
 13
13 -
 14
14 -
 15
15 -
16
-
17
-
18
-
19
-
20
-
21
-
22
-
23
-
24
-
25
-
26
-
27
-
28
-
29
-
30
-
31
-
32
-
33
-
34
-
35
-
36
-
37
-
38
-
39
-
40
-
41
-
42
-
43
-
44
-
45
-
46
-
47
-
48
-
49
-
50
-
51
-
52
-
53
-
54
-
55
-
56
-
57
-
58
-
59
-
60
-
61
-
62
-
63
-
64
-
65
-
66
-
67
-
68
-
69
-
70
-
71
-
72
-
73
-
74
-
75
-
76
-
77
-
78
-
79
-
80
-
81
-
82
-
83
-
84
-
85
-
86
-
87
-
88
-
89
-
90
-
91
-
92
-
93
-
94
-
95
-
96
-
97
-
98
-
99
-
100
-
101
-
102
-
103
-
104
 |
 |

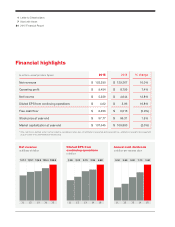
Record revenue and earnings helped us return more
than $6 billion to shareholders
Once again, we met or exceeded all of our key financial
targets through our ongoing focus on three pillars that
we consider essential to maximizing shareholder value:
• Productive, long-term growth;
• Generating significant free cash flow; and
• Optimizing capital allocation.
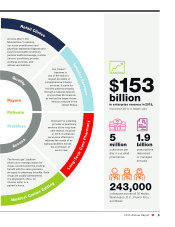
Net revenues for the year increased 10 percent to a
record $153 billion, while adjusted earnings per share
(EPS) rose nearly 15 percent to $5.16 on a comparable
basis. That excludes amortization, acquisition-related
costs, and a charge related to a disputed 1999 legal
settlement in 2015; it excludes amortization and the loss
on the early extinguishment of debt in 2014. Looking
back at the steady state targets we introduced in 2010
for the subsequent five-year period, I am happy to report
that the company’s growth hit the higher end of each
target range. Operating profit has risen at a 10 percent
compounded annual growth rate (CAGR), while adjusted
EPS has grown at a 14 percent CAGR.
CVS Health generated $6.5 billion in free cash flow during
2015 and returned more than $6 billion to shareholders
through dividends and share repurchases. Our board of
directors increased our quarterly dividend by 27 percent
and approved an additional 21 percent increase for 2016.
That marks our 13th consecutive year of increases and
keeps us on track to reach a 35 percent dividend payout
ratio target by 2018. We expect to return more than
$5 billion to shareholders in 2016 through dividends and
share repurchases.
The Omnicare and Target deals represent efficient
strategic uses of our capital that will help drive long-term
growth. Even after financing both acquisitions through
debt, we still have a strong balance sheet with well-lad-
dered debt maturities. We maintain a high triple-B credit
rating that allows CVS Health to continue to effectively
finance the working capital needs of the company.
While the stock market has been tumultuous, CVS Health
shares produced a total return of 2.9 percent in 2015 to
outperform the major indices. Over the same period, the
S&P 500 Index and the Dow Jones Industrial Average
returned 1.4 percent and 0.2 percent, respectively. We
have notably outperformed these indices on a three-,
five-, and 10-year basis as well.
High retention rates and new business wins reflect the
value of the CVS Caremark® PBM model
The capabilities of CVS Caremark remain unmatched in
the PBM marketplace, fueling strong top- and bottom-line
growth in 2015. Another highly successful selling season
resulted in $14.8 billion in gross new client business
to start 2016. While health plans accounted for roughly
80 percent of our wins, we were also very successful in
the employer segment with more than 90 new clients
totaling $1.8 billion in revenue. With a 98 percent client
retention rate, net new client business for 2016 totaled
$12.7 billion.
We are winning with our strong record of service and
execution, our competitive pricing, and by bringing
unique solutions to the market to meet a broad range
of client concerns. Surveys have shown that cost
control is our clients’ top priority. This is followed by
a variety of additional factors, with each of our client
channels having different priorities. Our flexibility and
expertise in addressing them has certainly been key
to our success.
We led the market with the first formulary exclusions in
2012, ensuring patient access to high-quality medications
at the lowest possible cost to clients. Since that time,
we’ve identified additional exclusions on an annual
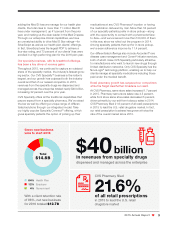
basis. Most recently, we took bold steps in 2015 with
Hepatitis C medications and PCSK9 inhibitors. These
expensive therapies are key potential drivers of rising
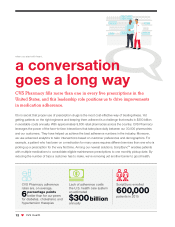
costs—or “trend”—for clients. Through our strategies, we
expect to have saved clients $6.4 billion for the five-year
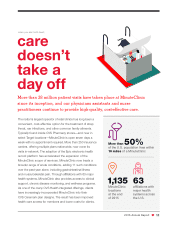
period through 2016. Oversight and strategic pharmacy
management cut our clients’ trend by more than half in
2015, despite record levels of drug price increases. This
past year we also launched a valuable surveillance and
reporting tool—Interactive Rx Insights—that allows our
sales team to simulate the impact of plan designs and
show clients how specific solutions reduce the impact of
trend drivers.
Our Medicare Part D (Med D) business had another
successful Annual Enrollment Period for 2016. The
SilverScript® Prescription Drug Plan (PDP) added 500,000
lives, raising total enrollment to 5 million captive PDP
lives, including Employee Group Waiver Plans. When
2CVS Health
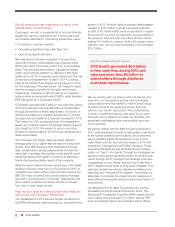
ADDING SHAREHOLDER VALUE
CVS Health generated $6.5 billion
in free cash flow during 2015 and
returned more than $6 billion to
shareholders through dividends
and share repurchases.