CVS 2015 Annual Report Download - page 29
Download and view the complete annual report
Please find page 29 of the 2015 CVS annual report below. You can navigate through the pages in the report by either clicking on the pages listed below, or by using the keyword search tool below to find specific information within the annual report.-
 1
1 -
2
-
3
-
4
-
5
-
6
-
7
-
8
-
9
-
10
-
11
-
12
-
13
-
14
-
15
-
16
-
17
-
18
-
 19
19 -
 20
20 -
 21
21 -
 22
22 -
 23
23 -
 24
24 -
 25
25 -
 26
26 -
 27
27 -
 28
28 -
 29
29 -
 30
30 -
 31
31 -
 32
32 -
 33
33 -
 34
34 -
 35
35 -
 36
36 -
 37
37 -
 38
38 -
 39
39 -
40
-
41
-
42
-
43
-
44
-
45
-
46
-
47
-
48
-
49
-
50
-
51
-
52
-
53
-
54
-
55
-
56
-
57
-
58
-
59
-
60
-
61
-
62
-
63
-
64
-
65
-
66
-
67
-
68
-
69
-
70
-
71
-
72
-
73
-
74
-
75
-
76
-
77
-
78
-
79
-
80
-
81
-
82
-
83
-
84
-
85
-
86
-
87
-
88
-
89
-
90
-
91
-
92
-
93
-
94
-
95
-
96
-
97
-
98
-
99
-
100
-
101
-
102
-
103
-
104
 |
 |

27
2015 Annual Report
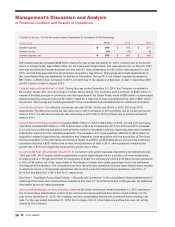
Net income attributable to CVS Health
increased $593 million or 12.8% to $5.2 billion (or $4.63 per diluted share)
in 2015. This compares to $4.6 billion (or $3.96 per diluted share) in 2014 and $4.6 billion (or $3.74 per diluted share)
in 2013. As discussed previously, the 2015 increase in net income attributable to CVS Health was primarily related
to increased generic drug dispensing and increased prescription volume in both operating segments, as well as
the loss on early extinguishment of debt in 2014. The increase in 2015 was negatively affected by $272 million of
acquisition-related bridge financing, transaction and integration costs associated with the acquisition of Omnicare
and the acquisition of the pharmacies and clinics of Target. The increase in net income attributable to CVS Health
per diluted share was also driven by increased share repurchase activity in 2015, 2014 and 2013. The net income
attributable to CVS Health and per diluted share in 2014 includes a $521 million loss on early extinguishment of
debt, which negatively impacted the net income growth rate in 2014.
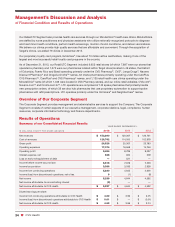
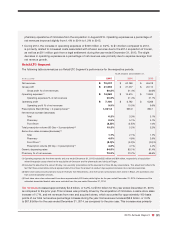
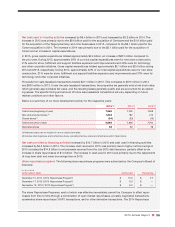
Segment Analysis
We evaluate the performance of our Pharmacy Services and Retail/LTC segments based on net revenues, gross
profit and operating profit before the effect of nonrecurring charges and gains and certain intersegment activities.
The Company evaluates the performance of its Corporate Segment based on operating expenses before the effect
of discontinued operations, nonrecurring charges and gains, and certain intersegment activities. The following is a
reconciliation of the Company’s business segments to the consolidated financial statements:
Pharmacy
Services Retail/LTC Corporate Intersegment Consolidated
IN MILLIONS Segment (1) (2) Segment (2) Segment Eliminations (2) Totals
2015:
Net revenues
$ 100,363 $ 72,007 $ — $ (19,080) $ 153,290
Gross profit 5,227 21,992 — (691) 26,528
Operating profit (loss) (3) 3,989 7,130 (1,037) (628) 9,454
2014:
Net revenues 88,440 67,798 — (16,871) 139,367
Gross profit 4,771 21,277 — (681) 25,367
Operating profit (loss) 3,514 6,762 (796) (681) 8,799
2013:
Net revenues 76,208 65,618 — (15,065) 126,761
Gross profit 4,237 20,112 — (566) 23,783
Operating profit (loss) (4) 3,086 6,268 (751) (566) 8,037
(1) Net revenues of the Pharmacy Services Segment include approximately $8.9 billion, $8.1 billion and $7.9 billion of Retail Co-Payments for 2015,
2014 and 2013, respectively. See Note 1 to the consolidated financial statements for additional information about Retail Co-Payments.
(2) Intersegment eliminations relate to intersegment revenue generating activities that occur between the Pharmacy Services Segment and the
Retail/LTC Segment. These occur in the following ways: when members of Pharmacy Services Segment clients (“members”) fill prescriptions
at retail stores to purchase covered products, when members enrolled in programs such as Maintenance Choice® elect to pick up maintenance
prescriptions at a retail drugstore instead of receiving them through the mail, or when members have prescriptions filled at long-term care facilities.
When these occur, both the Pharmacy Services and Retail/LTC segments record the revenues, gross profit and operating profit on a standalone basis.
(3) For the year ended December 31, 2015, the Corporate Segment operating loss includes $156 million of acquisition-related transaction and
integration costs and a $90 million charge related to a legacy lawsuit challenging the 1999 legal settlement by MedPartners of various securities
class actions and a related derivative claim.
(4) Consolidated operating profit for the year ended December 31, 2013 includes a $72 million gain on a legal settlement, of which, $11 million is
included in the Pharmacy Services Segment and $61 million is included in the Retail/LTC Segment.