CVS 2015 Annual Report Download - page 32
Download and view the complete annual report
Please find page 32 of the 2015 CVS annual report below. You can navigate through the pages in the report by either clicking on the pages listed below, or by using the keyword search tool below to find specific information within the annual report.-
 1
1 -
2
-
3
-
4
-
5
-
6
-
7
-
8
-
9
-
10
-
11
-
12
-
13
-
14
-
15
-
16
-
17
-
18
-
19
-
20
-
21
-
 22
22 -
 23
23 -
 24
24 -
 25
25 -
 26
26 -
 27
27 -
 28
28 -
 29
29 -
 30
30 -
 31
31 -
 32
32 -
 33
33 -
 34
34 -
 35
35 -
 36
36 -
 37
37 -
 38
38 -
 39
39 -
 40
40 -
 41
41 -
 42
42 -
43
-
44
-
45
-
46
-
47
-
48
-
49
-
50
-
51
-
52
-
53
-
54
-
55
-
56
-
57
-
58
-
59
-
60
-
61
-
62
-
63
-
64
-
65
-
66
-
67
-
68
-
69
-
70
-
71
-
72
-
73
-
74
-
75
-
76
-
77
-
78
-
79
-
80
-
81
-
82
-
83
-
84
-
85
-
86
-
87
-
88
-
89
-
90
-
91
-
92
-
93
-
94
-
95
-
96
-
97
-
98
-
99
-
100
-
101
-
102
-
103
-
104
 |
 |

Management’s Discussion and Analysis
of Financial Condition and Results of Operations
30 CVS Health
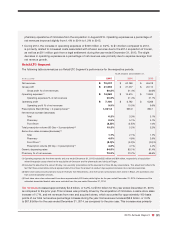
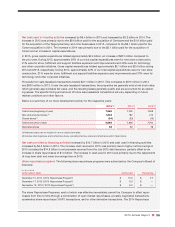
economics, partially offset by price compression. The decrease in gross profit as a percentage of net revenues was
primarily due to price compression, partially offset by favorable generic dispensing, as well as favorable purchasing
and rebate economics.
During 2014, gross profit increased $534 million, or 12.6% to $4.8 billion in the year ended December 31, 2014,
as compared to the prior year. Gross profit as a percentage of net revenues decreased to 5.4% for the year ended
December 31, 2014, compared to 5.6% in the prior year. The increase in gross profit dollars in the year ended
December 31, 2014 was primarily due to volume increases, higher generic dispensing and favorable purchasing
economics, partially offset by price compression. The decrease in gross profit as a percentage of net revenues was
due to price compression, partially offset by favorable generic dispensing and purchasing economics. In addition,
gross profit dollars and margin for the year ended December 31, 2014, were positively impacted by $16 million
related to the favorable resolution of previously proposed retroactive reimbursement rate changes in the State of
California Medicaid program.
As you review our Pharmacy Services Segment’s performance in this area, we believe you should consider the
following important information:
• Our gross profit dollars and gross profit as a percentage of net revenues continued to be impacted by our efforts
to (i) retain existing clients, (ii) obtain new business and (iii) maintain or improve the rebates and/or discounts
we received from manufacturers, wholesalers and retail pharmacies. In particular, competitive pressures in the
PBM industry have caused us and other PBMs to continue to share a larger portion of rebates and/or discounts
received from pharmaceutical manufacturers with clients. In addition, market dynamics and regulatory changes
have impacted our ability to offer plan sponsors pricing that includes retail network “differential” or “spread”.
We expect these trends to continue. The “differential” or “spread” is any difference between the drug price
charged to plan sponsors, including Medicare Part D plan sponsors, by a PBM and the price paid for the drug
by the PBM to the dispensing provider. The increased use by patients of generic drugs has positively impacted
our gross profit margins but has resulted in third party payors augmenting their efforts to reduce reimbursement
payments for prescriptions. This trend, which we expect to continue, reduces the benefit we realize from brand
to generic product conversions.
• We review our network contracts on an individual basis to determine if the related revenues should be accounted
for using the gross method or net method under the applicable accounting rules. Our Pharmacy Services
Segment network contracts are predominantly accounted for using the gross method, which results in higher
revenues, higher cost of revenues and lower gross profit rates.
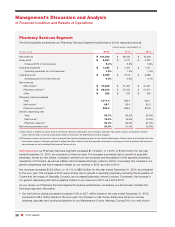
• Our gross profit as a percentage of revenues benefited from the increase in our total generic dispensing rate,
which increased to 83.7% and 82.2% in 2015 and 2014, respectively, compared to our generic dispensing rate
of 80.5% in 2013. These increases were primarily due to new generic drug introductions and our continued efforts
to encourage plan members to use clinically appropriate generic drugs when they are available. We expect these
trends to continue, albeit at a slower pace.
Operating expenses
in our Pharmacy Services Segment, which include selling, general and administrative
expenses, depreciation and amortization related to selling, general and administrative activities and retail specialty
pharmacy store and administrative payroll, employee benefits and occupancy costs, decreased to 1.2% of net
revenues in 2015, compared to 1.4% in 2014 and 1.5% in 2013.
As you review our Pharmacy Services Segment’s performance in this area, we believe you should consider the
following important information:
• Operating expenses decreased $19 million or 1.5%, to $1.2 billion, in the year ended December 31, 2015,
compared to the prior year. The decrease in operating expense dollars is primarily due to lower integration costs
from the Coram acquisition which occurred in January 2014, partially offset by the addition of the specialty