CVS 2015 Annual Report Download - page 33
Download and view the complete annual report
Please find page 33 of the 2015 CVS annual report below. You can navigate through the pages in the report by either clicking on the pages listed below, or by using the keyword search tool below to find specific information within the annual report.-
 1
1 -
2
-
3
-
4
-
5
-
6
-
7
-
8
-
9
-
10
-
11
-
12
-
13
-
14
-
15
-
16
-
17
-
18
-
19
-
20
-
21
-
22
-
 23
23 -
 24
24 -
 25
25 -
 26
26 -
 27
27 -
 28
28 -
 29
29 -
 30
30 -
 31
31 -
 32
32 -
 33
33 -
 34
34 -
 35
35 -
 36
36 -
 37
37 -
 38
38 -
 39
39 -
 40
40 -
 41
41 -
 42
42 -
 43
43 -
44
-
45
-
46
-
47
-
48
-
49
-
50
-
51
-
52
-
53
-
54
-
55
-
56
-
57
-
58
-
59
-
60
-
61
-
62
-
63
-
64
-
65
-
66
-
67
-
68
-
69
-
70
-
71
-
72
-
73
-
74
-
75
-
76
-
77
-
78
-
79
-
80
-
81
-
82
-
83
-
84
-
85
-
86
-
87
-
88
-
89
-
90
-
91
-
92
-
93
-
94
-
95
-
96
-
97
-
98
-
99
-
100
-
101
-
102
-
103
-
104
 |
 |

31
2015 Annual Report
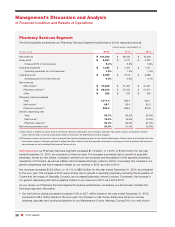
pharmacy operations of Omnicare from the acquisition in August 2015. Operating expenses as a percentage of
net revenues improved slightly from 1.4% in 2014 to 1.2% in 2015.
• During 2014, the increase in operating expenses of $106 million or 9.2%, to $1.3 billion compared to 2013,
is primarily related to increased costs associated with infusion services due to the 2014 acquisition of Coram,
as well as an $11 million gain from a legal settlement during the year ended December 31, 2013. The slight
decrease in operating expenses as a percentage of net revenues was primarily due to expense leverage from
net revenue growth.
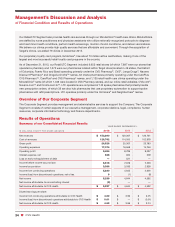
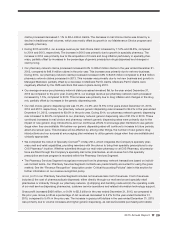
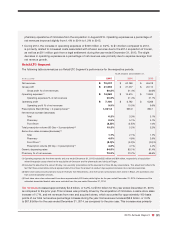
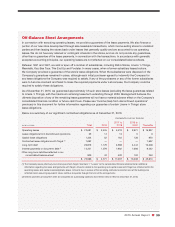
Retail/LTC Segment
The following table summarizes our Retail/LTC Segment’s performance for the respective periods:
YEAR ENDED DECEMBER 31,
IN MILLIONS 2015 2014 2013
Net revenues $ 72,007 $ 67,798 $ 65,618
Gross profit $ 21,992 $ 21,277 $ 20,112
Gross profit % of net revenues 30.5 % 31.4 % 30.6 %
Operating expenses (1) $ 14,862 $ 14,515 $ 13,844
Operating expenses % of net revenues 20.6 % 21.4 % 21.1 %
Operating profit $ 7,130 $ 6,762 $ 6,268
Operating profit % of net revenues 9.9 % 10.0 % 9.6 %
Prescriptions filled (90 Day = 3 prescriptions) (2) 1,031.6 935.9 890.1
Net revenue increase (decrease):
Total 6.2 % 3.3 % 3.1 %
Pharmacy 9.5 % 5.1 % 4.1 %
Front Store (2.5)% (2.5)% 1.0 %
Total prescription volume (90 Day = 3 prescriptions) (2) 10.2 % 5.2 % 5.2 %
Same store sales increase (decrease) (3):
Total 1.7 % 2.1 % 1.7 %
Pharmacy 4.5 % 4.8 % 2.6 %
Front Store (4) (5.0)% (4.0)% (0.5)%
Prescription volume (90 Day = 3 prescriptions) (2) 4.8 % 4.1 % 4.4 %
Generic dispensing rates 84.5 % 83.1 % 81.4 %
Pharmacy % of net revenues 72.9 % 70.7 % 69.5 %
(1) Operating expenses for the three months and year ended December 31, 2015 include $52 million and $64 million, respectively, of acquisition-
related integration costs related to the acquisition of Omnicare and the pharmacies and clinics of Target.
(2) Includes the adjustment to convert 90-day, non-specialty prescriptions to the equivalent of three 30-day prescriptions. This adjustment reflects the
fact that these prescriptions include approximately three times the amount of product days supplied compared to a normal prescription.
(3) Same store sales and prescriptions exclude revenues from MinuteClinic, and revenue and prescriptions from stores in Brazil, LTC operations and
from commercialization services.
(4) Front store same store sales would have been approximately 520 basis points higher for the year ended December 31, 2015 if tobacco and the
estimated associated basket sales were excluded from the year ended December 31, 2014.
Net revenues
increased approximately $4.2 billion, or 6.2%, to $72.0 billion for the year ended December 31, 2015,
as compared to the prior year. This increase was primarily driven by the acquisition of Omnicare, a same store sales
increase of 1.7%, and net revenues from new and acquired stores, which accounted for approximately 160 basis
points of our total net revenue percentage increase during the year. Net revenues increased $2.2 billion, or 3.3%
to $67.8 billion for the year ended December 31, 2014, as compared to the prior year. This increase was primarily