CVS 2015 Annual Report Download - page 36
Download and view the complete annual report
Please find page 36 of the 2015 CVS annual report below. You can navigate through the pages in the report by either clicking on the pages listed below, or by using the keyword search tool below to find specific information within the annual report.-
 1
1 -
2
-
3
-
4
-
5
-
6
-
7
-
8
-
9
-
10
-
11
-
12
-
13
-
14
-
15
-
16
-
17
-
18
-
19
-
20
-
21
-
22
-
23
-
24
-
25
-
 26
26 -
 27
27 -
 28
28 -
 29
29 -
 30
30 -
 31
31 -
 32
32 -
 33
33 -
 34
34 -
 35
35 -
 36
36 -
 37
37 -
 38
38 -
 39
39 -
 40
40 -
 41
41 -
 42
42 -
 43
43 -
 44
44 -
 45
45 -
 46
46 -
47
-
48
-
49
-
50
-
51
-
52
-
53
-
54
-
55
-
56
-
57
-
58
-
59
-
60
-
61
-
62
-
63
-
64
-
65
-
66
-
67
-
68
-
69
-
70
-
71
-
72
-
73
-
74
-
75
-
76
-
77
-
78
-
79
-
80
-
81
-
82
-
83
-
84
-
85
-
86
-
87
-
88
-
89
-
90
-
91
-
92
-
93
-
94
-
95
-
96
-
97
-
98
-
99
-
100
-
101
-
102
-
103
-
104
 |
 |

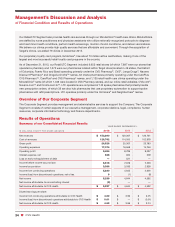
Management’s Discussion and Analysis
of Financial Condition and Results of Operations
34 CVS Health
revenues, in the prior year. Operating expenses as a percentage of net revenues for the year ended December 31,
2015 improved primarily due to higher legal costs in the prior year and leverage gained from the addition of LTC net
revenues. The increase in operating expense dollars for the year ended December 31, 2015, was primarily due to the
addition of LTC, including acquisition-related integration costs of $64 million, and incremental store operating costs
associated with operating more stores. Operating expenses as a percentage of net revenues increased in 2014
primarily due to reimbursement rate pressure, the implementation of Specialty Connect, which reduced net reve-
nues, and higher legal costs. The increase in operating expense dollars in 2014 and 2013 was the result of higher
store operating costs associated with our increased store count, as well as higher legal costs. The results for the
years ended December 31, 2014 and 2013 include gains from legal settlements of $21 million and $61 million,
respectively. Additionally, in September 2014, the Retail/LTC Segment made a charitable contribution of $25 million
to the CVS Foundation to fund future charitable giving. The foundation is a non-profit entity that focuses on health,
education and community involvement programs.
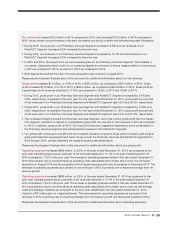
Corporate Segment
Operating expenses
increased $241 million, or 30.3%, to $1.0 billion in the year ended December 31, 2015, as
compared to the prior year. Operating expenses increased $45 million, or 6.0%, to $796 million in the year ended
December 31, 2014. Operating expenses within the Corporate Segment include executive management, corporate
relations, legal, compliance, human resources, corporate information technology and finance related costs. The
increase in operating expenses in 2015 was primarily due to acquisition-related transaction and integration costs
associated with the acquisition of Omnicare and Target’s pharmacy and clinic business, as well as a $90 million
charge related to a legacy lawsuit challenging the 1999 settlement by MedPartners of various securities class
actions and a related derivative claim. Total acquisition-related transaction and integration costs recorded in
the Corporate Segment for both acquisitions were $156 million and the charge for the lawsuit was $90 million
for the year ended December 31, 2015. The increase in operating expenses in 2014 was primarily due to increased
strategic initiatives, benefits costs, facilities management and information technology costs.
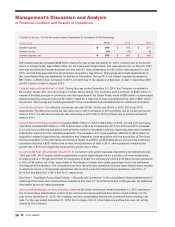
Liquidity and Capital Resources
We maintain a level of liquidity sufficient to allow us to cover our cash needs in the short-term. Over the long-term,
we manage our cash and capital structure to maximize shareholder return, maintain our financial position and maintain
flexibility for future strategic initiatives. We continuously assess our working capital needs, debt and leverage levels,
capital expenditure requirements, dividend payouts, potential share repurchases and future investments or acquisi-
tions. We believe our operating cash flows, commercial paper program, sale-leaseback program, as well as any
potential future borrowings, will be sufficient to fund these future payments and long-term initiatives.
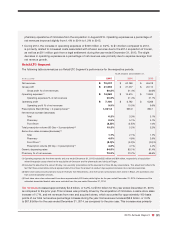
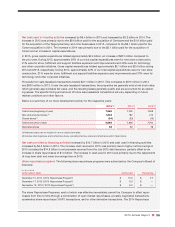
The change in cash and cash equivalents is as follows:
YEAR ENDED DECEMBER 31,
IN MILLIONS 2015 2014 2013
Net cash provided by operating activities
$ 8,412
$ 8,137 $ 5,783
Net cash used in investing activities
(13,420)
(4,045) (1,835)
Net cash provided by (used in) financing activities
5,006
(5,694) (1,237)
Effect of exchange rate changes on cash and cash equivalents
(20)
(6) 3
Net increase (decrease) in cash and cash equivalents
$ (22)
$ (1,608) $ 2,714
Net cash provided by operating activities
increased by $275 million in 2015 and $2.4 billion in 2014. The increase in
2015 was primarily due to increased net income partially offset by various changes in working capital. The increase
in 2014 was primarily due to increased net income and increased accounts payable due to payables management
and timing.