CVS 2015 Annual Report Download - page 96
Download and view the complete annual report
Please find page 96 of the 2015 CVS annual report below. You can navigate through the pages in the report by either clicking on the pages listed below, or by using the keyword search tool below to find specific information within the annual report.-
 1
1 -
2
-
3
-
4
-
5
-
6
-
7
-
8
-
9
-
10
-
11
-
12
-
13
-
14
-
15
-
16
-
17
-
18
-
19
-
20
-
21
-
22
-
23
-
24
-
25
-
26
-
27
-
28
-
29
-
30
-
31
-
32
-
33
-
34
-
35
-
36
-
37
-
38
-
39
-
40
-
41
-
42
-
43
-
44
-
45
-
46
-
47
-
48
-
49
-
50
-
51
-
52
-
53
-
54
-
55
-
56
-
57
-
58
-
59
-
60
-
61
-
62
-
63
-
64
-
65
-
66
-
67
-
68
-
69
-
70
-
71
-
72
-
73
-
74
-
75
-
76
-
77
-
78
-
79
-
80
-
81
-
82
-
83
-
84
-
85
-
 86
86 -
 87
87 -
 88
88 -
 89
89 -
 90
90 -
 91
91 -
 92
92 -
 93
93 -
 94
94 -
 95
95 -
 96
96 -
 97
97 -
 98
98 -
 99
99 -
 100
100 -
 101
101 -
 102
102 -
 103
103 -
 104
104
 |
 |

94 CVS Health
Notes to Consolidated Financial Statements
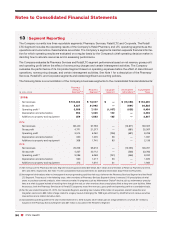
13 | Segment Reporting
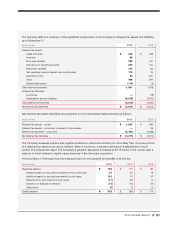
The Company currently has three reportable segments: Pharmacy Services, Retail/LTC and Corporate. The Retail/
LTC Segment includes the operating results of the Company’s Retail Pharmacy and LTC operating segments as the
operations and economics characteristics are similar. The Company’s segments maintain separate financial informa-
tion for which operating results are evaluated on a regular basis by the Company’s chief operating decision maker in
deciding how to allocate resources and in assessing performance.
The Company evaluates its Pharmacy Services and Retail/LTC segment performance based on net revenue, gross profit
and operating profit before the effect of nonrecurring charges and certain intersegment activities. The Company
evaluates the performance of its Corporate Segment based on operating expenses before the effect of discontinued
operations, nonrecurring charges, and certain intersegment activities. See Note 1 for a description of the Pharmacy
Services, Retail/LTC and Corporate segments and related significant accounting policies.
The following table is a reconciliation of the Company’s business segments to the consolidated financial statements:
Pharmacy
Services Retail/LTC Corporate Intersegment Consolidated
IN MILLIONS Segment(1) (2) Segment
(2) Segment Eliminations
(2) Totals
2015:
Net revenues
$ 100,363 $ 72,007 $ — $ (19,080) $ 153,290
Gross profit
5,227 21,992 — (691) 26,528
Operating profit (3)
3,989 7,130 (1,037) (628) 9,454
Depreciation and amortization
654 1,336 102 — 2,092
Additions to property and equipment
359 1,883 125 — 2,367
2014:
Net revenues 88,440 67,798 — (16,871) 139,367
Gross profit 4,771 21,277 — (681) 25,367
Operating profit 3,514 6,762 (796) (681) 8,799
Depreciation and amortization 630 1,205 96 — 1,931
Additions to property and equipment 308 1,745 83 — 2,136
2013:
Net revenues 76,208 65,618 — (15,065) 126,761
Gross profit 4,237 20,112 — (566) 23,783
Operating profit (4) 3,086 6,268 (751) (566) 8,037
Depreciation and amortization 560 1,217 93 — 1,870
Additions to property and equipment 313 1,610 61 — 1,984
(1) Net revenues of the Pharmacy Services Segment include approximately $8.9 billion, $8.1 billion and $7.9 billion of Retail Co-Payments for 2015,
2014 and 2013, respectively. See Note 1 to the consolidated financial statements for additional information about Retail Co-Payments.
(2) Intersegment eliminations relate to intersegment revenue generating activities that occur between the Pharmacy Services Segment and the Retail/
LTC Segment. These occur in the following ways: when members of Pharmacy Services Segment clients (“members”) fill prescriptions at retail
stores to purchase covered products, when members enrolled in programs such as Maintenance Choice® elect to pick up maintenance prescrip-
tions at a retail drugstore instead of receiving them through the mail, or when members have prescriptions filled at long-term care facilities. When
these occur, both the Pharmacy Services an d Retail/LTC segments record the revenues, gross profit and operating profit on a standalone basis.
(3) For the year ended December 31, 2015, the Corporate Segment operating loss includes $156 million of acquisition-related transaction and
integration costs and a $90 million charge related to a legacy lawsuit challenging the 1999 legal settlement by MedPartners of various securities
class actions and a related derivative claim.
(4) Consolidated operating profit for the year ended December 31, 2013 includes a $72 million gain on a legal settlement, of which, $11 million is
included in the Pharmacy Services Segment and $61 million is included in the Retail/LTC Segment.