CVS 2015 Annual Report Download - page 62
Download and view the complete annual report
Please find page 62 of the 2015 CVS annual report below. You can navigate through the pages in the report by either clicking on the pages listed below, or by using the keyword search tool below to find specific information within the annual report.-
 1
1 -
2
-
3
-
4
-
5
-
6
-
7
-
8
-
9
-
10
-
11
-
12
-
13
-
14
-
15
-
16
-
17
-
18
-
19
-
20
-
21
-
22
-
23
-
24
-
25
-
26
-
27
-
28
-
29
-
30
-
31
-
32
-
33
-
34
-
35
-
36
-
37
-
38
-
39
-
40
-
41
-
42
-
43
-
44
-
45
-
46
-
47
-
48
-
49
-
50
-
51
-
 52
52 -
 53
53 -
 54
54 -
 55
55 -
 56
56 -
 57
57 -
 58
58 -
 59
59 -
 60
60 -
 61
61 -
 62
62 -
 63
63 -
 64
64 -
 65
65 -
 66
66 -
 67
67 -
 68
68 -
 69
69 -
 70
70 -
 71
71 -
 72
72 -
73
-
74
-
75
-
76
-
77
-
78
-
79
-
80
-
81
-
82
-
83
-
84
-
85
-
86
-
87
-
88
-
89
-
90
-
91
-
92
-
93
-
94
-
95
-
96
-
97
-
98
-
99
-
100
-
101
-
102
-
103
-
104
 |
 |

60 CVS Health
Notes to Consolidated Financial Statements
Fair value hierarchy The Company utilizes the three-level valuation hierarchy for the recognition and disclosure of
fair value measurements. The categorization of assets and liabilities within this hierarchy is based upon the lowest level
of input that is significant to the measurement of fair value. The three levels of the hierarchy consist of the following:
• Level 1 – Inputs to the valuation methodology are unadjusted quoted prices in active markets for identical assets
or liabilities that the Company has the ability to access at the measurement date.
• Level 2 – Inputs to the valuation methodology are quoted prices for similar assets and liabilities in active markets,
quoted prices in markets that are not active or inputs that are observable for the asset or liability, either directly or
indirectly, for substantially the full term of the instrument.
• Level 3 – Inputs to the valuation methodology are unobservable inputs based upon management’s best estimate
of inputs market participants could use in pricing the asset or liability at the measurement date, including assump-
tions about risk.
Cash and cash equivalents Cash and cash equivalents consist of cash and temporary investments with maturities
of three months or less when purchased. The Company invests in short-term money market funds, commercial paper
and time deposits, as well as other debt securities that are classified as cash equivalents within the accompanying
consolidated balance sheets, as these funds are highly liquid and readily convertible to known amounts of cash.
These investments are classified within Level 1 of the fair value hierarchy because they are valued using quoted
market prices.
Short-term investments The Company’s short-term investments consist of certificates of deposit with initial
maturities of greater than three months when purchased that mature in less than one year from the balance sheet
date. These investments, which were classified as available-for-sale within Level 1 of the fair value hierarchy, were
carried at fair value, which approximated their historical cost at December 31, 2015 and 2014.
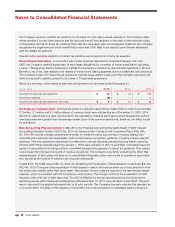
Fair value of financial instruments As of December 31, 2015, the Company’s financial instruments include cash
and cash equivalents, short-term and long-term investments, accounts receivable, accounts payable, contingent
consideration liability and short-term debt. Due to the nature of these instruments, the Company’s carrying value
approximates fair value. The carrying amount and estimated fair value of total long-term debt was $27.5 billion and
$28.4 billion, respectively, as of December 31, 2015. The fair value of the Company’s long-term debt was estimated
based on quoted rates currently offered in active markets for the Company’s debt, which is considered Level 1 of
the fair value hierarchy. The Company had outstanding letters of credit, which guaranteed foreign trade purchases,
with a fair value of $4 million as of December 31, 2015. There were no outstanding derivative financial instruments
as of December 31, 2015 and 2014.
Foreign currency translation and transactions For local currency functional currency, assets and liabilities are
translated at end-of-period rates while revenues and expenses are translated at average rates in effect during the
period. Equity is translated at historical rates and the resulting cumulative translation adjustments are included as
a component of accumulated other comprehensive income (loss).
For U.S. dollar functional currency locations, foreign currency assets and liabilities are remeasured into U.S. dollars
at end-of-period exchange rates, except for non-monetary balance sheet accounts, which are remeasured at
historical exchange rates. Revenue and expense are remeasured at average exchange rates in effect during each
period, except for those expenses related to the nonmonetary balance sheet amounts, which are remeasured at
historical exchange rates. Gains or losses from foreign currency remeasurement are included in income.
Gains and losses arising from foreign currency transactions and the effects of remeasurements were not material
for all periods presented.
Accounts receivable Accounts receivable are stated net of an allowance for doubtful accounts. The accounts
receivable balance primarily includes amounts due from third party providers (e.g., pharmacy benefit managers,
insurance companies, governmental agencies and long-term care facilities), clients, members and private pay
customers, as well as vendors and manufacturers. Charges to bad debt are based on both historical write-offs
and specifically identified receivables.