Berkshire Hathaway 2005 Annual Report Download - page 71
Download and view the complete annual report
Please find page 71 of the 2005 Berkshire Hathaway annual report below. You can navigate through the pages in the report by either clicking on the pages listed below, or by using the keyword search tool below to find specific information within the annual report.-
 1
1 -
2
-
3
-
4
-
5
-
6
-
7
-
8
-
9
-
10
-
11
-
12
-
13
-
14
-
15
-
16
-
17
-
18
-
19
-
20
-
21
-
22
-
23
-
24
-
25
-
26
-
27
-
28
-
29
-
30
-
31
-
32
-
33
-
34
-
35
-
36
-
37
-
38
-
39
-
40
-
41
-
42
-
43
-
44
-
45
-
46
-
47
-
48
-
49
-
50
-
51
-
52
-
53
-
54
-
55
-
56
-
57
-
58
-
59
-
60
-
 61
61 -
 62
62 -
 63
63 -
 64
64 -
 65
65 -
 66
66 -
 67
67 -
 68
68 -
 69
69 -
 70
70 -
 71
71 -
 72
72 -
 73
73 -
 74
74 -
 75
75 -
 76
76 -
 77
77 -
 78
78 -
 79
79 -
 80
80 -
 81
81 -
82
 |
 |

70
Management’s Discussion (Continued)
Property and casualty losses (Continued)
General Re (Continued)
Loss triangles are used to determine the expected case loss emergence patterns and, in conjunction with expected loss
ratios by accident year, are further used to determine IBNR reserves. Additional calculations form the basis for estimating the
expected loss emergence pattern. The determination of the expected loss emergence pattern is not strictly a mechanical process.
In instances where the historical loss data is insufficient, estimation formulas are used along with reliance on other loss triangles
and judgment. Factors affecting loss development triangles include but are not limited to the following: changing client claims
practices, changes in claim examiners use of ACR’ s or the frequency of client company claim reviews, changes in policy terms
and coverage (such as client loss retention levels and occurrence and aggregate policy limits), changes in loss trends and changes
in legal trends that result in unanticipated losses, as well as other sources of statistical variability. These items influence the
selection of the expected loss emergence patterns.
Expected loss ratios are selected by reserve cell, by accident year, based upon reviewing indicated ultimate loss ratios
predicted from aggregated pricing statistics. Indicated ultimate loss ratios are calculated using the selected loss emergence
pattern, reported losses and earned premium. If the selected emergence pattern is not accurate, then the indicated ultimate loss
ratios will not be correct and this can influence the selected loss ratios and hence the IBNR reserve. As with selected loss
emergence patterns, selecting expected loss ratios is not a strictly mechanical process and judgment is used in the analysis of
indicated ultimate loss ratios and department pricing loss ratios.
IBNR reserves are estimated by reserve cell, by accident year, using the expected loss emergence pattern and the
expected loss ratios. The expected loss emergence patterns and expected loss ratios are the critical IBNR reserving assumptions
and are generally updated every year-end. Once the year-end IBNR reserves are determined, actuaries calculate expected case
loss emergence for the upcoming calendar year. This calculation does not involve new assumptions and uses the prior year-end
expected loss emergence patterns and expected loss ratios. The expected losses are then allocated into interim estimates that are
compared to actual reported losses in the subsequent year. This comparison provides a test of the adequacy of prior year-end
IBNR reserves and forms the basis for possibly changing IBNR reserve assumptions during the course of the year.
In certain reserve cells (such as excess directors and officers and errors and omissions) IBNR reserves are based on
estimated ultimate losses, without consideration of expected emergence patterns. These cells typically involve a spike in loss
activity arising from recent industry developments making it difficult to select an expected loss emergence pattern as has been
experienced from the recent wave of corporate scandals that have caused an increase in reported losses. Overall industry-wide
loss experience data and informed judgment are used when internal loss data is of limited reliability, such as in setting the
estimates for asbestos and hazardous waste claims. Unpaid environmental, asbestos and mass tort reserves at December 31, 2005
were approximately $1.8 billion gross and $1.3 billion net of reinsurance. Such reserves were approximately $1.6 billion gross
and $1.3 billion net of reinsurance as of December 31, 2004. Claims paid attributable to such losses were about $93 million in
2005.
BHRG
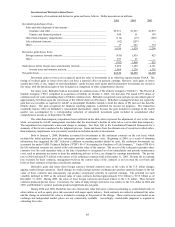
BHRG’ s unpaid losses and loss adjustment expenses as of December 31, 2005 are summarized as follows. Amounts
are in millions.
Property Casualty Total
Reported case reserves .......................................................... $ 3,860 $ 1,476 $ 5,336
IBNR reserves ....................................................................... 997 1,900 2,897
Retroactive ............................................................................ — 8,969 8,969
Gross reserves ....................................................................... $ 4,857 $12,345 17,202
Ceded reserves and deferred charges..................................... (2,625)
Net reserves........................................................................... $14,577
As of December 31, 2005, BHRG’ s gross loss reserves related to retroactive reinsurance policies were attributed to
casualty losses. Retroactive policies include excess-of-loss contracts, in which losses (relating to past loss events) above a
contractual retention are indemnified or contracts that indemnify all losses paid by the counterparty after the policy effective
date. Retroactive losses paid in 2005 totaled $969 million. The classification “reported case reserves” has no practical analytical
value with respect to retroactive policies since the amount is derived from reports in bulk from ceding companies, who may have
inconsistent definitions of “case reserves.” Reserves are reviewed and established in the aggregate including provisions for
IBNR reserves.
In establishing retroactive reinsurance reserves, historical aggregate loss payment patterns are analyzed and projected
into the future under various scenarios. The claim-tail is expected to be very long for many policies and may last several
decades. Management attributes judgmental probability factors to these aggregate loss payment scenarios and an expectancy
outcome is determined. Due to contractual limits of indemnification, the maximum losses payable under retroactive policies are
approximately $11.5 billion as of December 31, 2005.