Berkshire Hathaway 2005 Annual Report Download - page 38
Download and view the complete annual report
Please find page 38 of the 2005 Berkshire Hathaway annual report below. You can navigate through the pages in the report by either clicking on the pages listed below, or by using the keyword search tool below to find specific information within the annual report.-
 1
1 -
2
-
3
-
4
-
5
-
6
-
7
-
8
-
9
-
10
-
11
-
12
-
13
-
14
-
15
-
16
-
17
-
18
-
19
-
20
-
21
-
22
-
23
-
24
-
25
-
26
-
27
-
 28
28 -
 29
29 -
 30
30 -
 31
31 -
 32
32 -
 33
33 -
 34
34 -
 35
35 -
 36
36 -
 37
37 -
 38
38 -
 39
39 -
 40
40 -
 41
41 -
 42
42 -
 43
43 -
 44
44 -
 45
45 -
 46
46 -
 47
47 -
 48
48 -
49
-
50
-
51
-
52
-
53
-
54
-
55
-
56
-
57
-
58
-
59
-
60
-
61
-
62
-
63
-
64
-
65
-
66
-
67
-
68
-
69
-
70
-
71
-
72
-
73
-
74
-
75
-
76
-
77
-
78
-
79
-
80
-
81
-
82
 |
 |

37
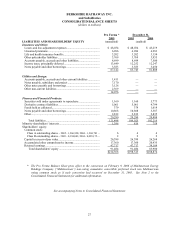
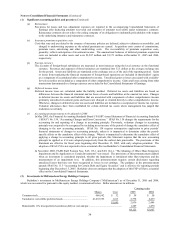
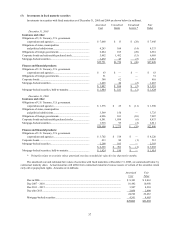
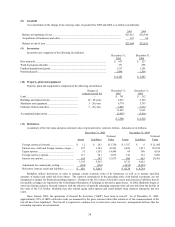
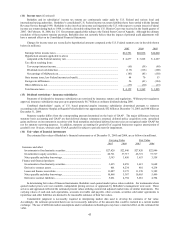
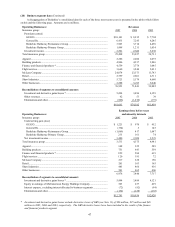
(5) Investments in fixed maturity securities
Investments in securities with fixed maturities as of December 31, 2005 and 2004 are shown below (in millions).
A
mortized Unrealized Unrealized Fai
r
Cost Gains Losses * Value
December 31, 2005
Insurance and other:
Obligations of U.S. Treasury, U.S. government
corporations and agencies ........................................................ $ 7,660 $ 13 $ (28) $ 7,645
Obligations of states, municipalities
and political subdivisions ......................................................... 4,243 104 (14) 4,333
Obligations of foreign governments ................................................ 6,884 105 (28) 6,961
Corporate bonds and redeemable preferred stock............................ 5,492 1,492 (15) 6,969
Mortgage-backed securities ............................................................. 1,472 45 (5) 1,512
$25,751 $1,759 $ (90) $27,420
Finance and financial products:
Obligations of U.S. Treasury, U.S. government
corporations and agencies ........................................................ $ 63 $ — $ — $ 63
Obligations of foreign governments ................................................ 51 — — 51
Corporate bonds............................................................................... 348 62 — 410
Mortgage-backed securities ............................................................. 1,425 44 (2) 1,467
$ 1,887 $ 106 $ (2) $ 1,991
Mortgage-backed securities, held-to-maturity................................. $ 1,444 $ 181 $ (1) $ 1,624
December 31, 2
0
0
4
Insurance and other:
Obligations of U.S. Treasury, U.S. government
corporations and agencies ........................................................ $ 1,576 $ 25 $ (11) $ 1,590
Obligations of states, municipalities
and political subdivisions ......................................................... 3,569 156 — 3,725
Obligations of foreign governments ................................................ 6,996 101 (10) 7,087
Corporate bonds and redeemable preferred stocks.......................... 6,541 1,898 (6) 8,433
Mortgage-backed securities ............................................................. 1,918 95 (2) 2,011
$20,600 $ 2,275 $ (29) $22,846
Finance and financial products:
Obligations of U.S. Treasury, U.S. government
corporations and agencies ........................................................ $ 3,702 $ 518 $ — $ 4,220
Corporate bonds............................................................................... 433 80 (1) 512
Mortgage-backed securities ............................................................. 2,200 103 — 2,303
$ 6,335 $ 701 $ (1) $ 7,035
Mortgage-backed securities, held-to-maturity................................. $ 1,424 $ 190 $ — $ 1,614
* Primarily relates to securities whose amortized cost has exceeded fair value for less than twelve months.
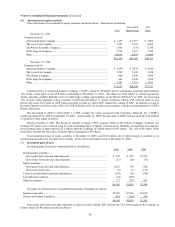
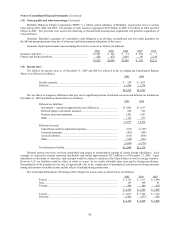
The amortized cost and estimated fair values of securities with fixed maturities at December 31, 2005, are summarized below by
contractual maturity dates. Actual maturities will differ from contractual maturities because issuers of certain of the securities retain
early call or prepayment rights. Amounts are in millions.
Amortized Fair
Cost Value
Due in 2006 ............................................................................................................................... $ 8,303 $ 8,463
Due 2007 – 2010 ....................................................................................................................... 10,482 10,950
Due 2011 – 2015 ....................................................................................................................... 3,907 4,210
Due after 2015........................................................................................................................... 2,050 2,809
24,742 26,432
Mortgage-backed securities....................................................................................................... 4,341 4,603
$29,083 $31,035